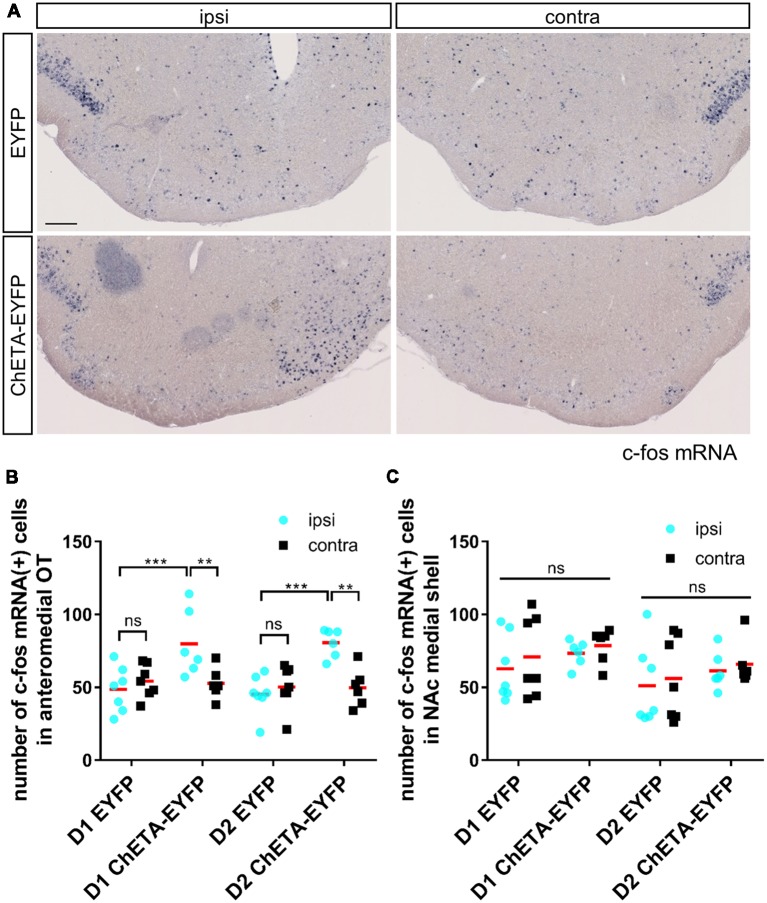
Figure 4.
c-fos expression induced by optogenetic stimulation was localized in the anteromedial OT during the RTPP tests. (A) Images of c-fos mRNA expression in the OT coronal sections after the RTPP tests. Left panels, ipsilateral; right panels, contralateral. Scale bar: 200 μm. (B) Number of c-fos mRNA-expressing cells in the anteromedial OT. (C) Number of c-fos mRNA-expressing cells in the NAc medial shell. Data shows mean with individual data plots. ns, not significant; **p < 0.01; ***p < 0.001. OT, olfactory tubercle; NAc, nucleus accumbens; RTPP, real-time place preference.

