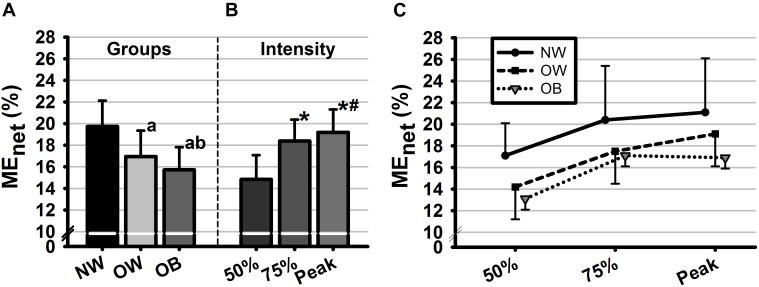
FIGURE 1.
Mean values of net mechanical efficiency (MEnet, %) as a function of (A) groups, (B) intensities, and (C) their interaction. Groups are defined in relation to weight status as normal weight (NW), overweight (OW) and obese (OB) and intensities are defined in reference to HRmax as 50%HRmax, 50%HRmax, and 100%HRmax. Error bars represent the standard deviation. aSignificant difference with NW (p < 0.01). bSignificant difference with OW (p < 0.01). ∗Significant difference with 50%HRmax. #Significant difference with 75%HRmax.

