FIGURE 3.

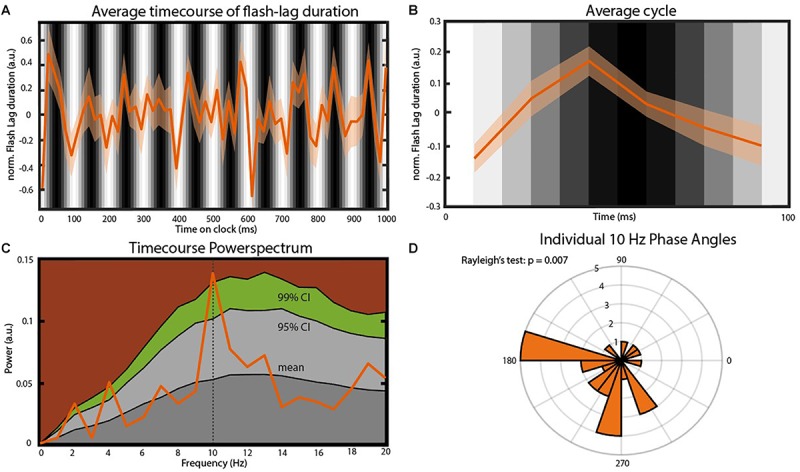
Main findings. (A) Average time course of FLE (N = 25). Before averaging the individual time courses were down-sampled from 120 to 60 Hz, detrended by subtracting the 1 Hz Fourier component and normalized using a moving z-score (window length 116 ms. See “Materials and Methods” section). The gray bars in the background indicate the luminance of the entrainer annulus at the moment of cue presentation. Transparent area shows the inter-subject SEM for the respective time point. (B) Average cycle of the oscillation observed in (A). Background Gray-scale bars indicate the luminance of the annulus at cue onset. Note that due to the down-sampling of the time course the six points of this average cycle always fall between two consecutive luminance bars. (C) Power-spectrum of the average FLE time-course. The peak at 10 Hz was statistically compared to a surrogate distribution (10.000 surrogates) and was significant after correcting for multiple comparisons (p = 0.004, FDR-corrected: p = 0.028). Colored areas: Dark gray, mean of the surrogate distribution; Light gray, 95% confidence interval; Green, 99% confidence interval; Brown, >99% confidence interval. (D) Rose plot of the 10 Hz phases angles of individual FLE time-courses. The Rayleigh’s test of non-uniformity reveals a significant phase coherence between individual 10 Hz phases (p = 0.007).
