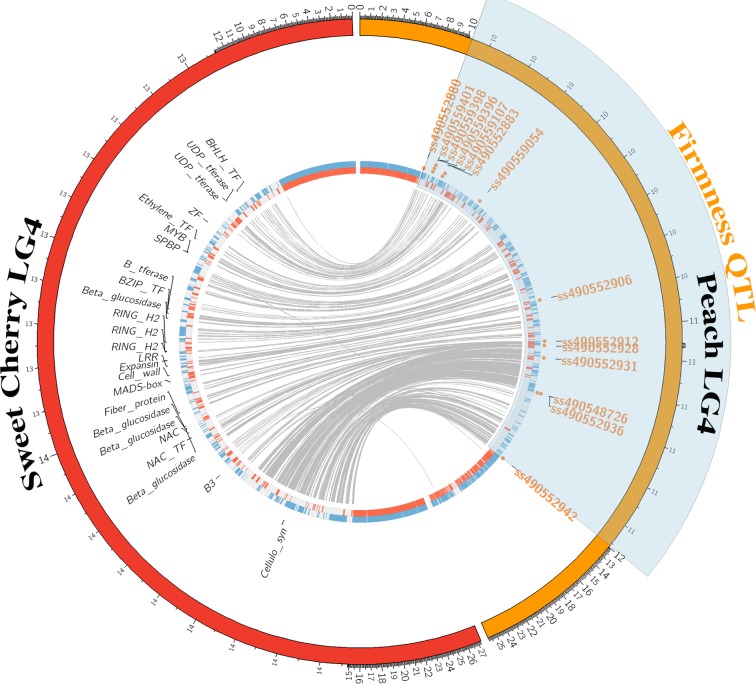
Figure 7.
A circos plot depicting linkage group (LG) 4 in the ‘Lovell’ peach reference genome v.2.0 (orange) and the corresponding LG 4 in the sweet cherry genome (red). The firmness QTL region is highlighted in translucent blue and mapped SNP markers as orange circular glyphs. The detailed information for SNP markers in the QTL region is presented in Table S6. The blue and red histograms are annotated genes, with direction of transcription as blue (forward) or red (reverse). Candidate genes are labeled in the sweet cherry region.

