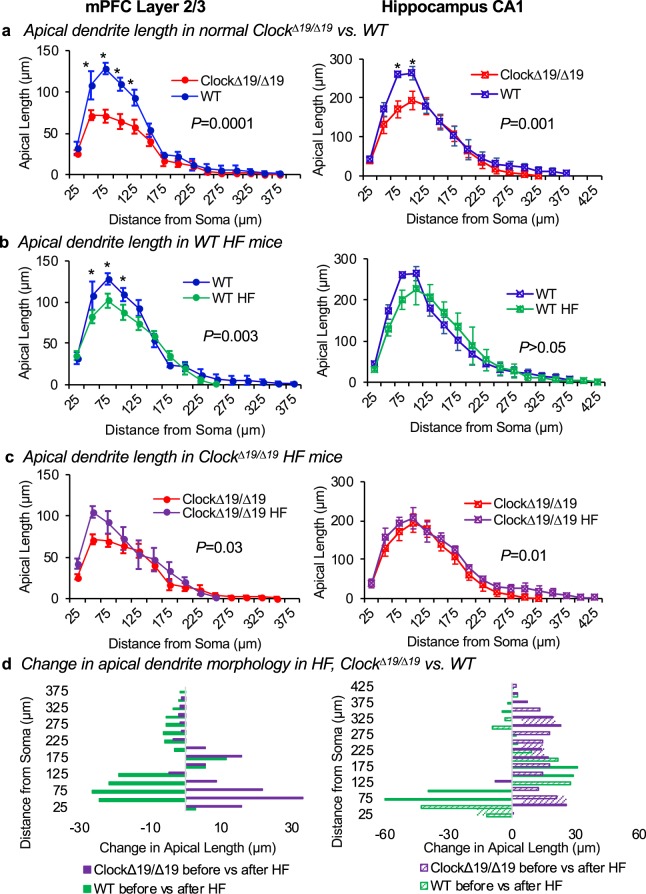
Figure 2.
Apical dendrite morphology differs in Clock∆19/∆19 vs. WT mice, baseline and HF. (a) Apical dendrite morphology was analyzed for mPFC layer 2/3 and hippocampus CA1 pyramidal neurons using a modified three-dimensional Sholl analysis. This analysis measured the length of apical dendrite between concentric spheres radiating outward from the soma. (a) Normal Clock∆19/∆19 mice have less apical dendrite length compared to WT mice in the mPFC (left, P = 0.0001) and the hippocampus (right, P = 0.001). (b) WT mice with HF exhibit decreased apical dendrite length in the mPFC (left, P = 0.003), but no change in apical dendrite length in hippocampus (right), as compared to non-HF WT controls. In contrast, (c) Clock∆19/∆19 mice with HF exhibit increased apical dendrite length in the mPFC (left, P = 0.03), and increased apical dendrite length in the hippocampus (right, P = 0.01), versus Clock∆19/∆19 controls. (d) Thus HF is associated with changes in apical dendrite length, and the direction and magnitude of change is different in Clock∆19/∆19 HF versus WT HF mice, in mPFC (left) and hippocampus (right) neurons. For mPFC: n = 4 mice per baseline group, n = 5 mice per HF group. For hippocampus: n = 4 mice per baseline group, n = 4 mice per HF group. Four neurons were traced and averaged for each mouse, and data are shown as mean ± SEM. *Indicates P < 0.05 by Bonferroni post-hoc analysis.

