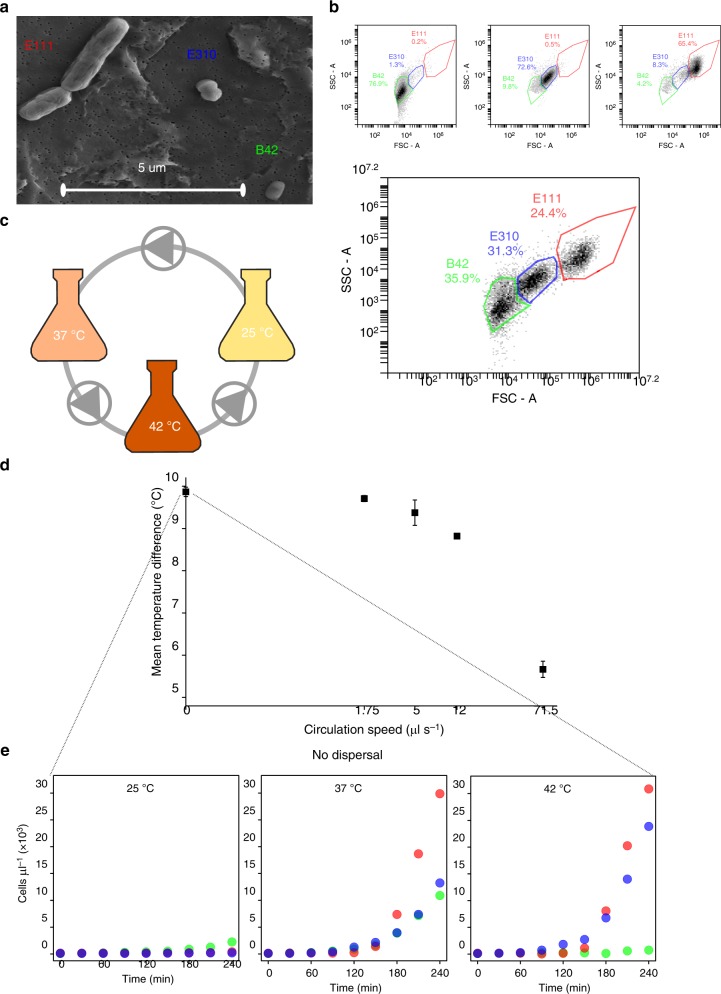
Fig. 2.
Overview of the synthetic community and experimental approaches. a Scanning electron microscopic (SEM) image of the three bacterial members of the synthetic community. E111: Bacillus sp., E310: Staphylococcus sp., B42: Chryseobacterium sp. b Forward scatter area (FSC-A—x axis)/side scatter area (SSC-A—y axis) plots of pure cultures (top) and of a mixture of the three bacteria (bottom). Colored lines represent non-overlapping gates that we drew based on pure cultures to calculate each population in the mixed culture. We show all three gates for the pure cultures (top) as examples for the calculation of spillover ratios (Methods). c Overview of the experimental set-up. Flasks represent incubation vessels at different temperatures (nominal values indicated on the flasks), gray curves represent tubing, and triangles within circles represent peristaltic pumps and the direction of the flow. All three bacterial strains were present within each incubation vessel at a 1:1:1 initial ratio, and all pumps had the same flow direction and speed. d The mean temperature difference among the three incubation vessels in the experiments with increasing dispersal. The x axis is in logarithmic scale and therefore zero is put at the beginning of the axis conventionally for illustration purposes (the real value at that point is 0.05 μl s−1). Error bars correspond to one standard error (n = 3). Source data are provided as a Source Data file. e The growth of each strain in the community over 4 h at each incubation vessel without dispersal. Each point represents the average of three replicate samples with an average coefficient of variation of 4.1%. We excluded the error bars to assist visualization. Source data are provided as a Source Data file

