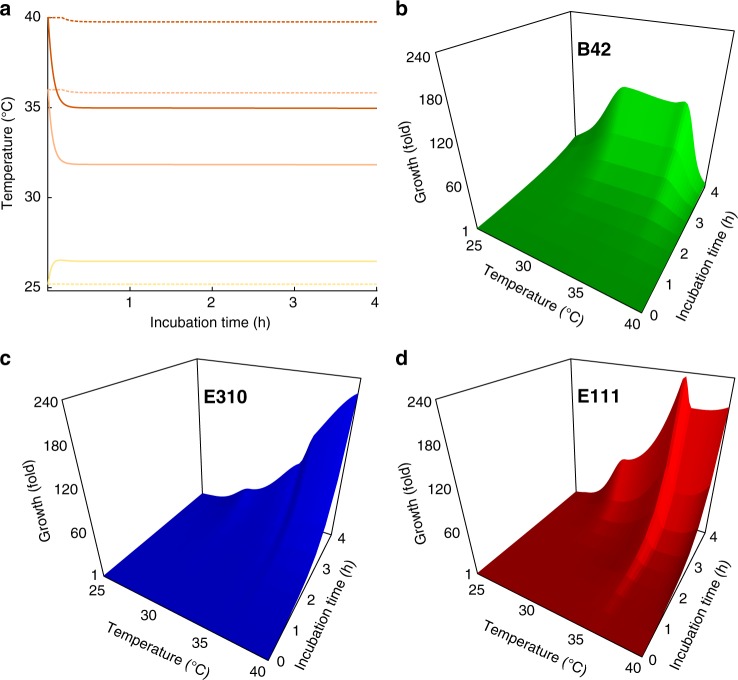
Fig. 4.
The modeled changes in temperature and the growth of each strain over time. a The dashed and the solid curves represent the temperature changes at the lowest (0.057 μl s−1) and the highest (71.5 μl s−1) circulation speed, respectively. Temperature values for intermediate circulation speeds fall between these two lines. Yellow represents vessels at nominal incubation temperature of 25 °C, light orange vessels at 37 °C, and dark orange vessels at 42 °C. b–d Temperature is given on the x axis, time is given on the y axis, and growth is given on the z axis. In all panels, temperature corresponds to the actual temperature within the incubation vessels, not the nominal

