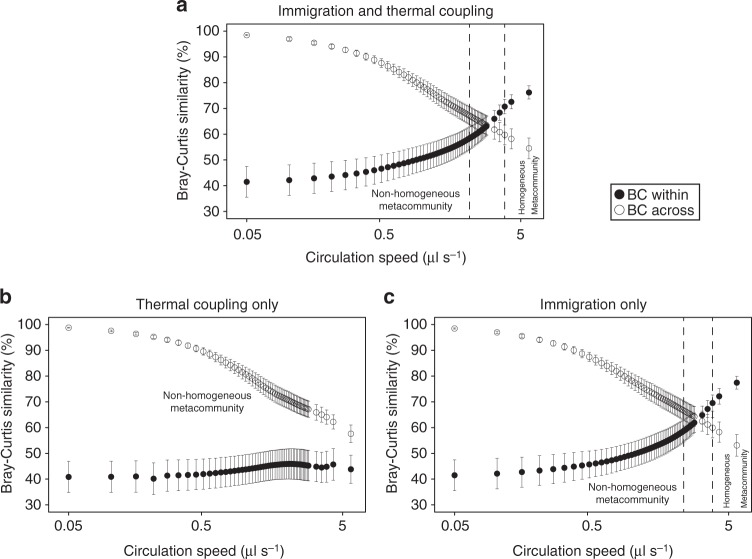
Fig. 6.
Community dynamics under the original model and in two alternative scenarios. a Dynamics in the original model that includes both immigration and thermal coupling. b Dynamics in the model that includes only thermal coupling. c Dynamics in the model that includes only immigration. Bray–Curtis (BC) similarity (y axis) is plotted as a function of increasing circulation speed (x axis, in logarithmic scale). Vertical dashed lines delimit the range of dispersal under which “BC within” is significantly lower than “BC across” (on the left of the left line) and vice versa (on the right of the right line; generalized linear mixed-effects models, corrected two-sided p < 0.05). Vertical bars represent one standard error (n = 21). Source data are provided as a Source Data file

