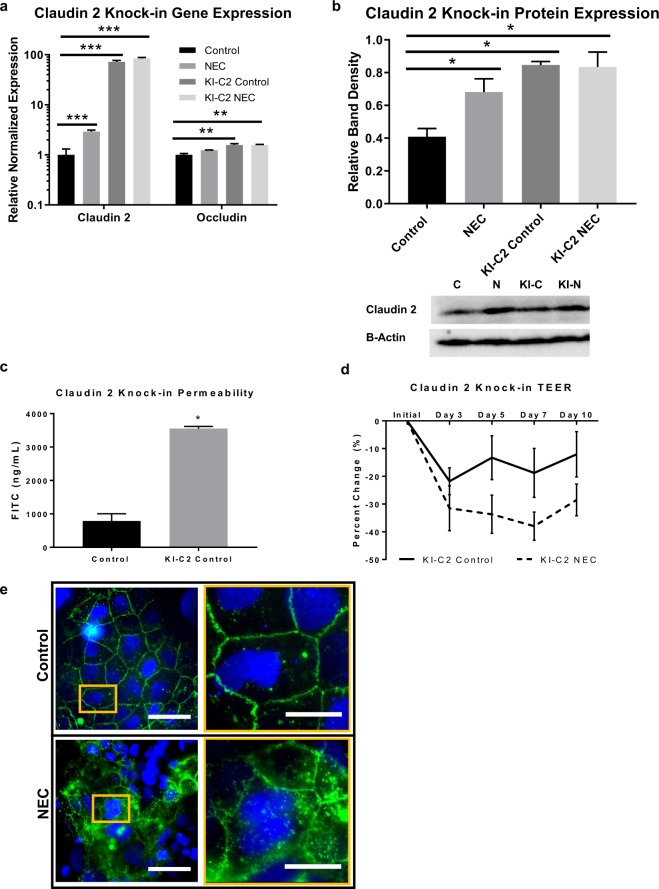
Figure 5.
Claudin 2 knock-in confers increased permeability in Caco-2 cells. (a) Caco-2 cells with claudin 2 knock-in have >70-fold greater gene expression of claudin 2 on qRT-PCR compared to wild type controls (n = 3 per group); KI-C2, Claudin 2 Knock-in. Occludin gene expression was less than 2-folds increased in knocked-in cells. (b) Western blot band densitometry graph confirms increased claudin 2 expression in knock-in cells compared to controls (n = at least 3 per group); representative immunoblots (full blots included in Supplementary Fig. S4) for claudin 2 were then probed with β-Actin (C, Control; N, NEC; KI-C, knock-in control; KI-N, knock-in NEC). (c) Permeability to 3 kDa FITC-dextran was increased in claudin 2 knock-in cells compared to controls (n = at least 9 per group). (d) TEER assay showed a trend towards further increased permeability in the claudin 2 knock-in cells after exposure to LPS, with the most pronounced effects after 5 days of exposure (p = 0.10). (e) Immunofluorescence microscopy of claudin 2 knock-in cells with green fluorescent tag shows focal expression of claudin 2 at the cell membrane that changes to an internalized localization with exposure to experimental NEC; left column scale bar = 20 uM scale bar, magnified inset (right column) scale bar = 50 uM; nuclei stained with DAPI (blue). All values are mean ± SEM (*p < 0.05, **p < 0.01, ***p < 0.001).

