Figure 3.
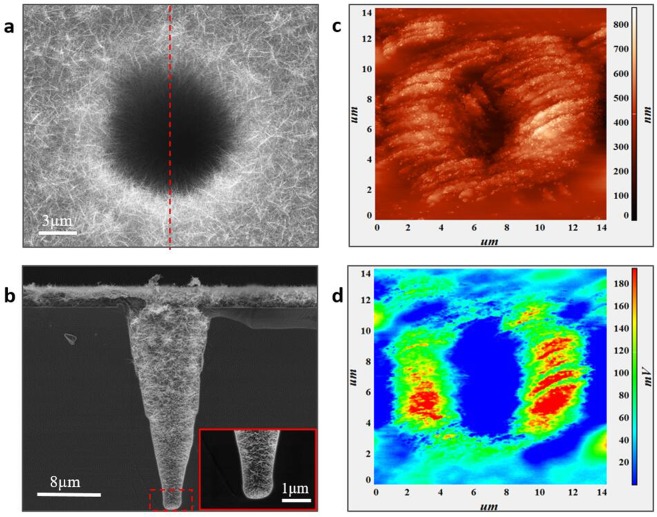
Morphology and electric field distribution of deep V-pits covered by ITO nanowire networks. (a) Single hole was covered by ITO nanowire networks completely. (b) All the inner-wall of the hole was covered by ITO nanowire networks, and the insert is the large image of bottom area. (c) The AFM image (measured by Contact Topography Mode) and (d) the electric field distribution of V-pits covered by nanowires were measured by SNOM through applying 10 V to the probe tip.

