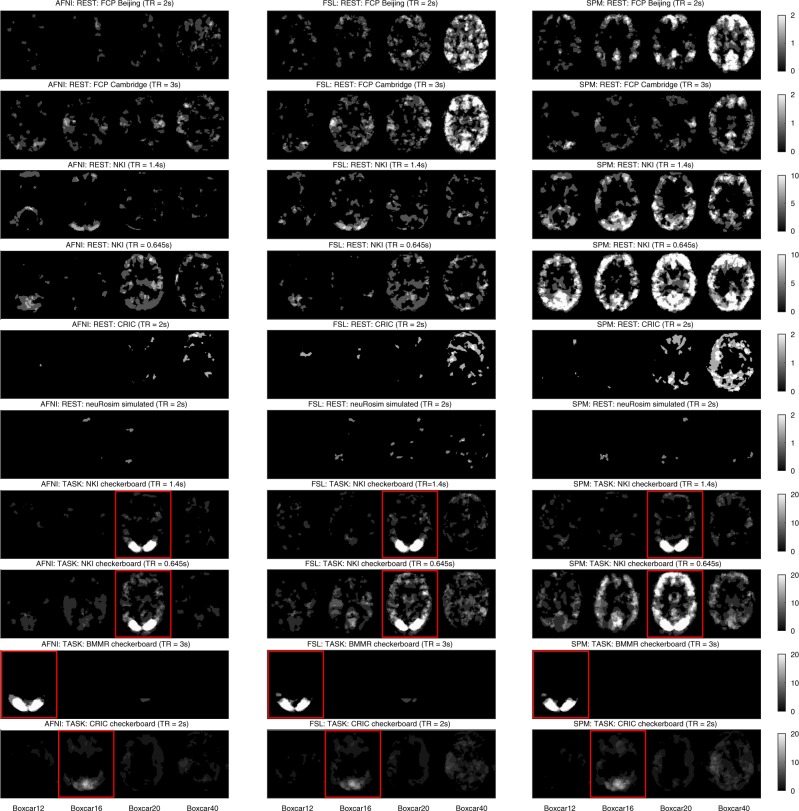
Fig. 2.
Spatial distribution of significant clusters in AFNI (left), FSL (middle), and SPM (right) for different assumed experimental designs. Scale refers to the percentage of subjects where significant activation was detected at the given voxel. The red boxes indicate the true designs (for task data). Resting state data were used as null data. Thus, low numbers of significant voxels were a desirable outcome, as it was suggesting high specificity. Task data with assumed wrong designs were used as null data too. Thus, large positive differences between the true design and the wrong designs were a desirable outcome. The clearest cut between the true and the wrong/dummy designs was obtained with AFNI’s noise model. FAST performed similarly to AFNI’s noise model (not shown)

