
Figure 4.
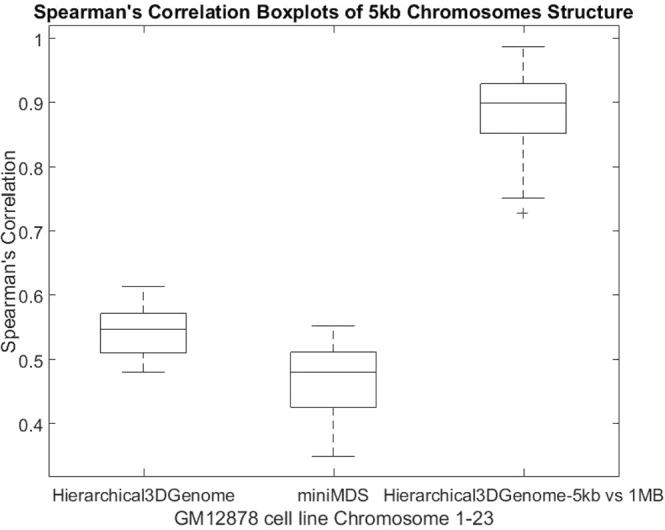
Spearman’s correlation boxplots of 5 kb chromosome structures built by Hierarchical3DGenome and miniMDS for GM12878 cell line Chromosome 1–23. The box plots of the Spearman’s correlation between reconstructed distances and expected distances for all 23 pairs of human chromosomes of Hierarchical3DGenome, miniMDS, and the consistency check of 5 KB-resolution Hierarchical3DGenome models with the models built directly from contact matrices of 1 MB resolution.