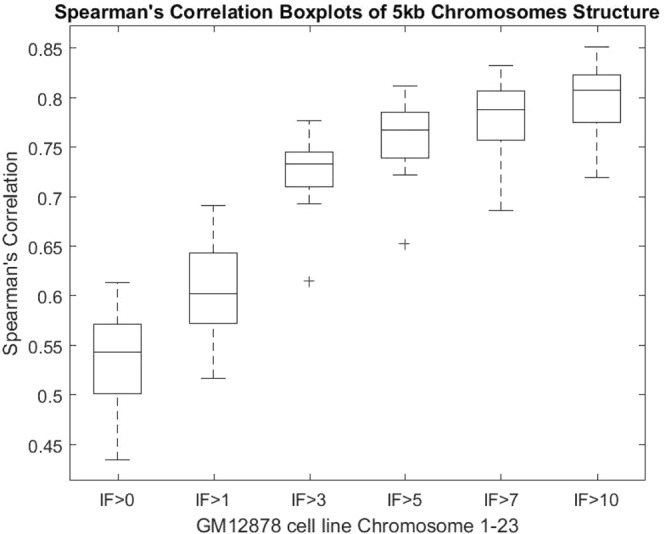
Figure 5.

Models’ Spearman’s correlation at increasing IF cut-off thresholds. Box plots of the Spearman’s correlation between the contact maps derived from chromosomal models and the input Hi-C data contact map for each chromosome at increasing IF cut-off threshold 0, 1, 3, 5, 7, 10. Contacts below each threshold are removed and not used in the Spearman correlation calculation for each chromosome. The Spearman’s correlation increases with respect to the increase of the cut-off threshold.
