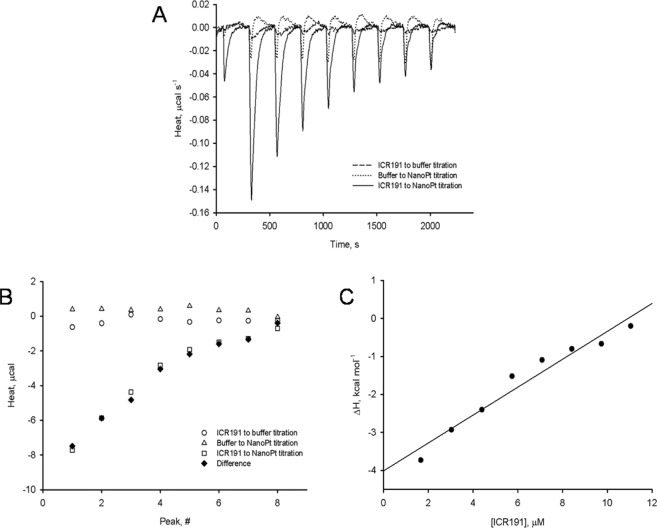
Figure 3.
Determination of enthalpy values for PtNPs-ICR-191 interactions: (A) thermograms presenting microcalorimetric titrations of PtNPs with ICR-191 (solid line), buffer with ICR-191 (dashed line) and PtNPs with buffer (dotted line), shown as heat released in time and (B) thermal effects of titrations of PtNPs with ICR-191 (squares), buffer with ICR-191 (circles) and PtNPs with buffer (triangles). Diamonds represent difference between the heat of PtNPs titration with ICR-191 and sum of heats obtained for control titrations (buffer-ICR-191, PtNPs-buffer), and (C) heat of ICR-191-PtNPs interactions (corrected for background thermal effects as described above), calculated as kcal mol−1 of injected ICR-191. The enthalpy change (ΔH) of ICR-191-PtNPs interactions, calculated by the linear regression (r2 = 0.95) of experimental points to [ICR-191] tending to zero, is equal to −4.01 ± 0.23 (±SE) kcal mol−1.

