Fig. 1.
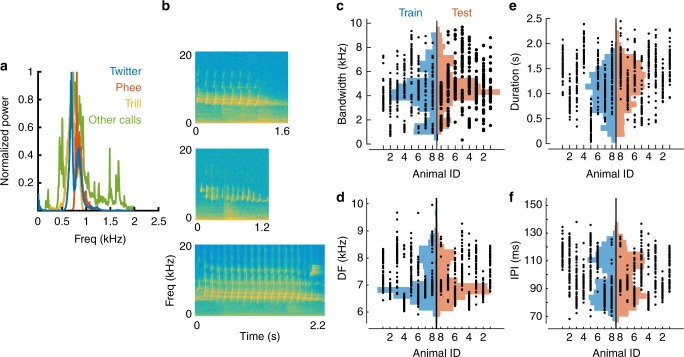
Production variability in marmoset calls. a The overall spectra of 3 major marmoset call types and other minor call types (grouped as ‘Other calls’), showing spectral overlap between call categories. b Spectrograms of three twitter calls showing examples of production variability between individuals. c–f Production variability of twitter calls quantified along multiple parameters: c bandwidth, d dominant frequency, e duration, and f inter-phrase interval. Dots are parameter values of a single call produced by an individual marmoset. Histograms are overall parameter distributions, split into the training (blue) and testing (red) sets. These data show the large production variability captured by the training and test datasets, over which the model must generalize. No systematic bias is evident in calls used for model training and testing

