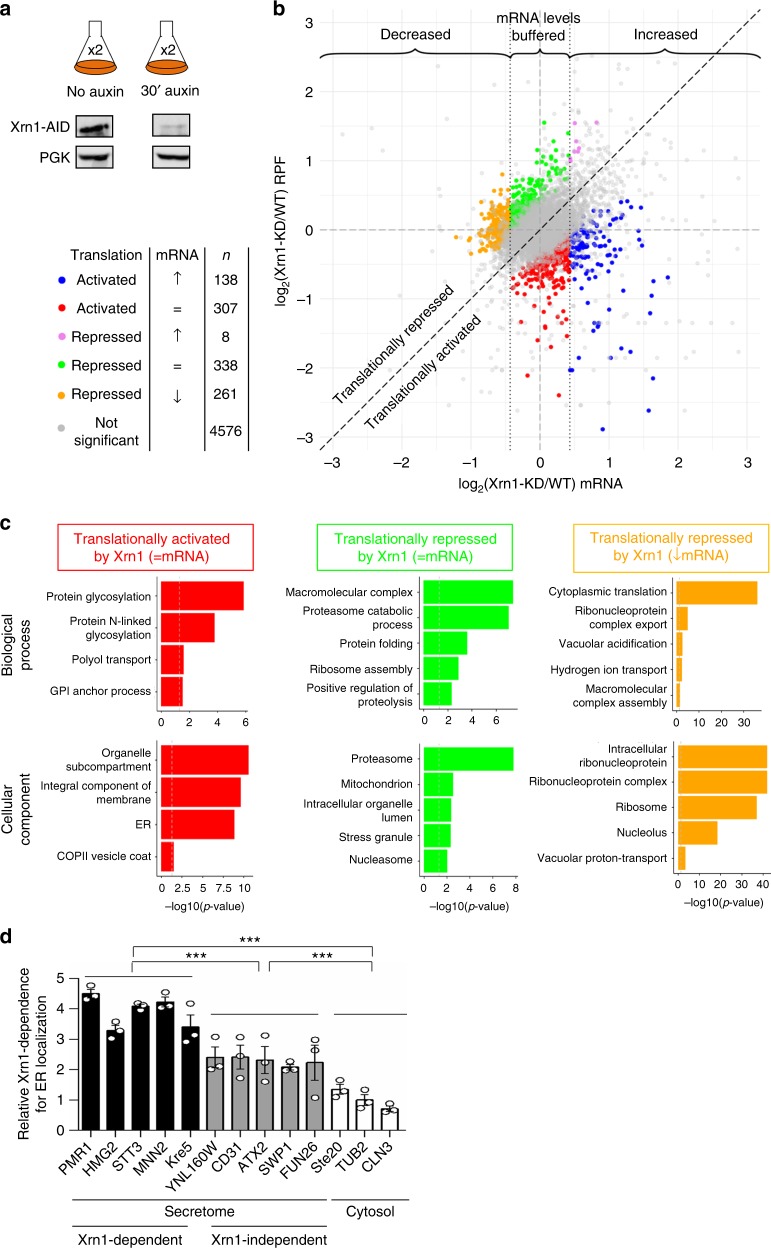
Fig. 5.
Xrn1 acts as a translational regulator of cellular mRNAs. a Experimental set-up used for ribosome-profiling analysis. Two duplicates for each condition (no auxin and 30 min with auxin) were included (n = 2). Western blot analysis corroborated Xrn1 depletion upon auxin addition. b Analysis of the results from the RNAseq and RPF libraries, comparing untreated cells (WT) to auxin-treated cells (Xrn1-KD). Log2 fold changes in mRNA abundance and ribosome occupancy (RPF) are represented. Vertical dashed lines in black depict the thresholds chosen to consider mRNA levels as stable/buffered ((log2 fold change) < 0.433); see ref. 13). A perfect correlation between changes in mRNA and ribosome occupancy levels is indicated by a dashed diagonal line. Gray dots correspond to genes with no significant change in translational control (Riborex FDR ≥ 0.05). Colored dots correspond to genes that show significant changes in translational regulation upon Xrn1 depletion (Riborex FDR < 0.05). These genes are classified into five different subgroups according to their behavior in terms of mRNA and RPF changes. c Gene ontology enrichment analysis (GSEA) of transcripts translationally regulated by Xrn1, focusing on Biological Process and Cellular Component. Colors correspond to the same groups of genes as described in Fig. 5b. At most five significant terms after Revigo redundancy removal are depicted (ordered by p-value). d Xrn1-dependence for translation correlates with Xrn1-dependence for ER localization. The y-axis indicates the ER localization:cytosol-localization in WT (no auxin) related to Xrn1-depleted cells (30 min of auxin treatment). The ratio of specific mRNAs between supernatant and membrane fractions was calculated in WT and xrn1∆ conditions. Xrn1-dependence for ER localization was calculated by dividing [(cc/cm) xrn1∆]/[(cc/cm) WT] (cc = conc. in the cytosol fraction; cm = concentration in the membrane fraction). The values were represented relative to TUB2, which was set to 1. Open circles indicate the individual data points. Values are the mean of n = 3 assays ± SEM. Statistical significance was calculated using a Student’s t-test (***p-value < 0.001). Source data are provided as a Source Data file

