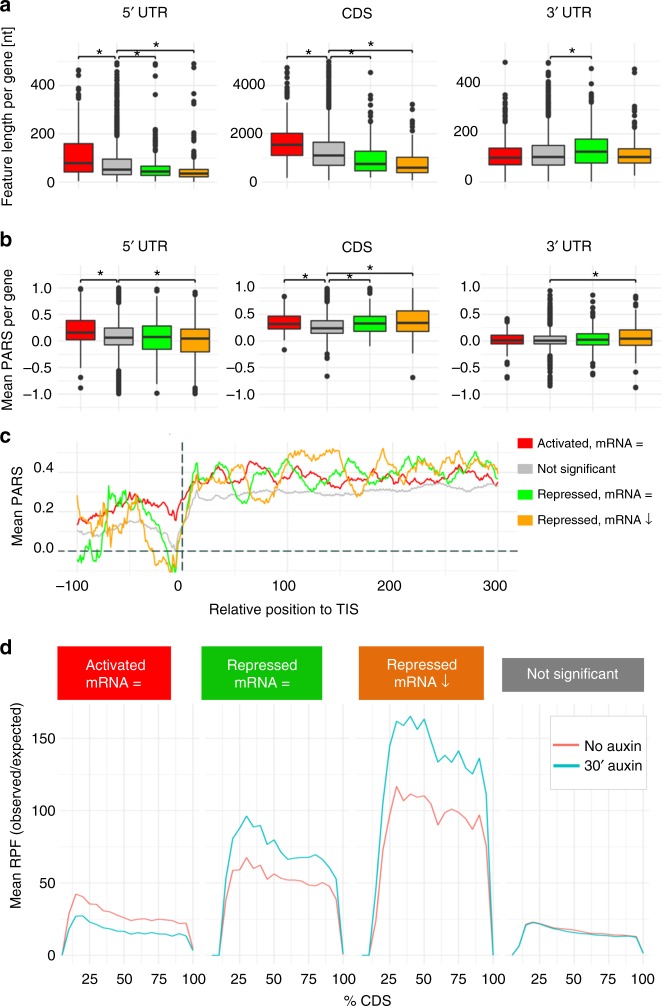
Fig. 6.
Features of mRNAs translationally controlled by Xrn1. a, b Box-plot depicting the mean length (a) and the mean PARS score (b) of the 5ʹUTRs, CDSs and 3ʹUTRs for the three subgroups studied and the control group (gray). For boxplots, box boundaries represent the 1st and 3rd quartile of the distribution, while the center line represents the 2nd quartile (median). Whiskers indicate either the most extreme values or extend to 1.5 times the interquartile range starting from the respective box boundary. Black dots indicate outliers (default R parameters). Statistical significance was calculated using a Wilcoxon-test (p-values available in Supplementary Data 4). c Metagene analysis of the PARS scores. Vertical dashed line corresponds to the translation initiation site (TIS). The x-axis represents the nucleotide position relative to the TIS. d Metagene analysis of the average mRNA-normalized RPF coverage along the CDS for activated (red, mRNA=), repressed (green, mRNA = and orange, mRNA ↓), and not affected mRNAs (gray). A light red line corresponds to untreated cells, whereas turquoise corresponds to treatment with auxin for 30 min

