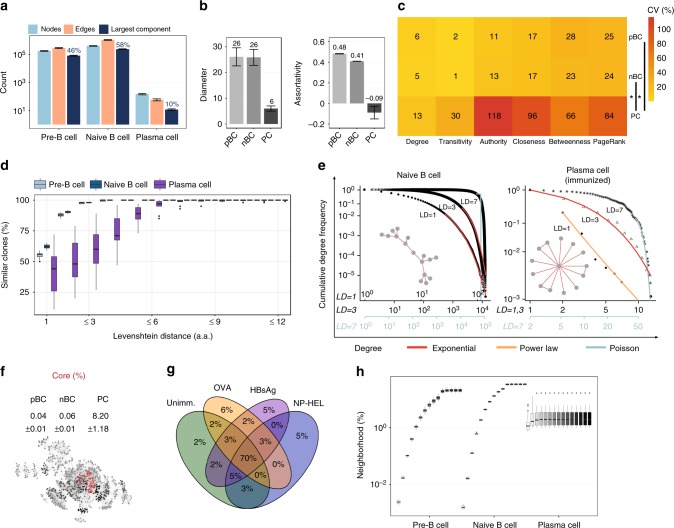
Fig. 2.
Global and clonal properties of antibody repertoire networks are reproducible. a Network size of antibody repertoires. The y-axis indicates the absolute number count of CDR3 nodes, CDR3 edges (similarities) and CDR3 clones in the largest component. The mean percentage of the CDR3s belonging to the largest component by B-cell development stage is shown on top of the dark blue bar. b Global properties, diameter and assortativity coefficient are shown for pre-B cells (pBC), naïve B cells (nBC) and plasma cells (PC). c The mean value of the coefficient of variation for clonal properties in pBC, nBC and PC repertoires. Wilcoxon test, ppBC,nBC/PC < 0.05 (see Methods). d Percentage of clones connected to at least one other clone in the repertoire at LD1, LD≤2, …, LD≤12 in pre-B cells, naïve B cells, plasma cells. e The power-law (orange), exponential (red) and Poisson (gray) distributions were fit to the cumulative degree distributions of naïve B cell and plasma cell (unimmunized) repertoires of a representative sample for similarity layers LD1,3,7 (log-log scale). Representative clusters are shown for LD1. f Percentage of CDR3 clones (mean ± s.e.m) that compose the maximal core. Subgraph of the maximal k-core (red), and k-1 (black), k-2 (dark gray) and k-3 (light gray) cores in a representative mouse pBC sample. g Percentage overlap of CDR3 germline V-genes in the maximal core of nBC repertoires (n = 5 mice and data sets for Unimm (unimmunized), OVA, NP-HEL, n = 4 mice sets for HBsAg, mean ± s.e.m). h Normalized neighborhood size for orders n = {1–10, 15, 20, 30, 40, 50} across CDR3 clones (similarity layer LD1). For a, b, d, barplots show mean ± s.e.m; for a–e, each B-cell stage n = 19 mice. Source data are provided as a Source Data file

