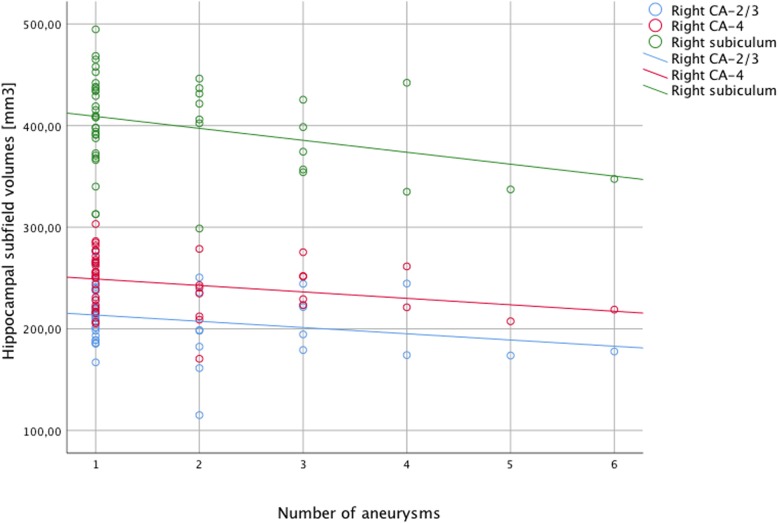
Fig. 2.
Scatter plot showing volumes of right hemispheric CA-2/3 (blue circles), CA-4 (red circles), and subiculum (green circles) on the y-axis and number of total aneurysms (x-axis). Linear regression lines are shown in order to illustrate negative correlations between hippocampal subfields and total number of aneurysms. CA cornu ammonis

