Fig. 3.
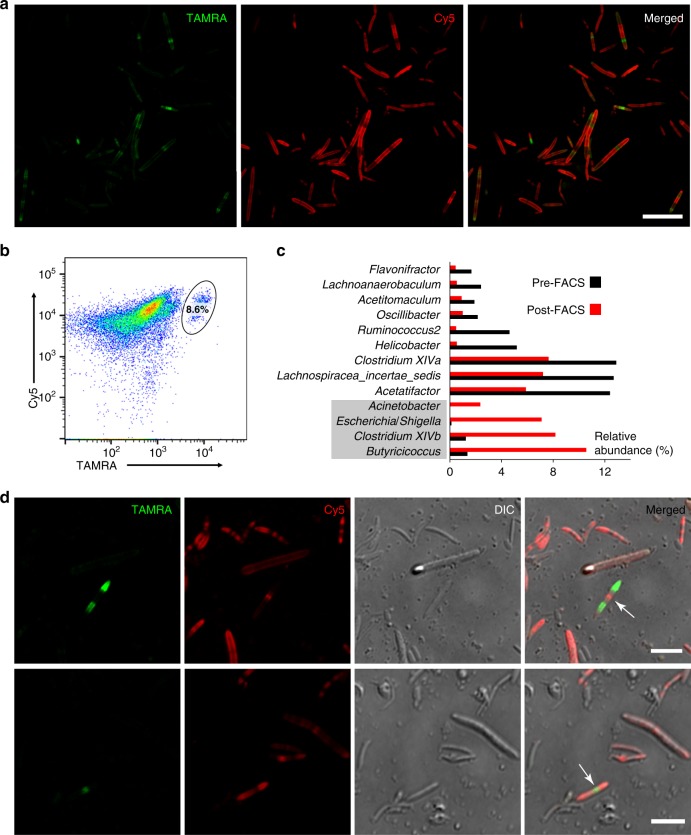
Two-color fluorescence analyses of the transplanted microbiotas. a Two-color fluorescence microscopy analyses of the transplanted microbiota from the recipient mice. Scale bar, 20 μm. b Flow cytometry analysis of the transplanted microbiotas from the recipient mice. The inserted ellipse indicates the survived transplants labeled with both colors, which accounts for 8.6% of the recipient mice’s microbiota. c 16S rDNA sequencing of the bacteria before and after sorting uncovered that several bacterial genera were enriched in the transplantation survivors. d Gut bacteria with two classical dividing patterns were revealed by two-color fluorescence microscopy. Scale bars, 5 μm. Representative data from three independent experiments are shown

