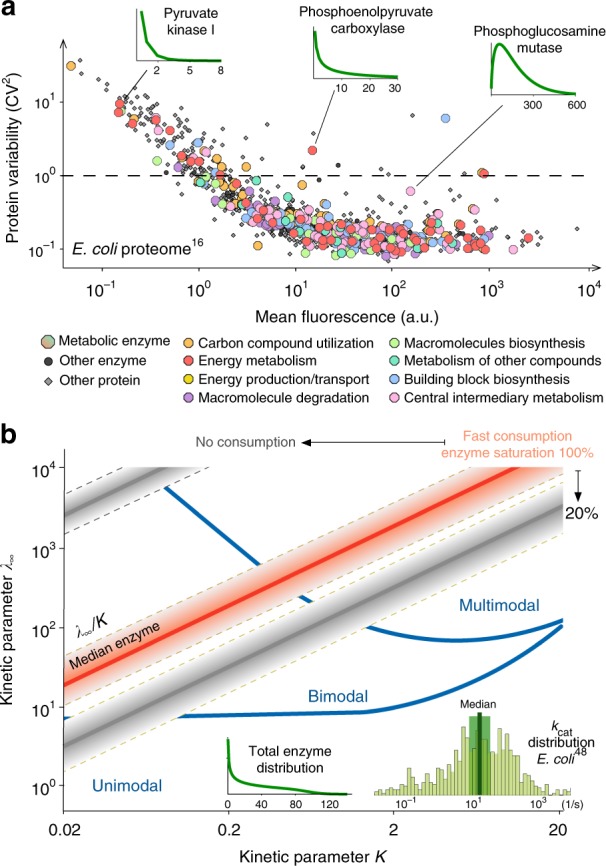
Fig. 4.

Model predictions and experimental data. a Single-cell measurements reveal that metabolic enzymes are as variable as other members of the proteome17. Data correspond to ~80% of the E. coli proteome, including 268 enzymes involved in various metabolic functions55 (coloured circles). The coefficient of variation (CV) is defined as the standard deviation over the mean of measured distributions. Distributions with CV > 1 (dashed line) are long-tailed and peak at zero, which resemble the distributions required for catalytically-induced bimodality and multimodality (Figs. 2b and 3); shown are the distributions of three representative enzymes computed from fitted Gamma distributions17. b Predictions of the Poisson Mixture Model for combinations of parameters λ∞ and K in Eq. (5). For a lowly abundant enzyme (distribution in inset), the model predicts unimodality, catalytically-induced bimodality and multimodality in large regions of the (λ∞, K) space. The red line represents a constant ratio λ∞/K for the median kcat ≈ 16.5 s−1 across 752 enzymes in E. coli, see kcat distribution displayed in the inset49. Shaded red corresponds to the lines obtained for kcat values within a range 0.5- and 2-fold of the median (highlighted in green in the inset). The grey lines and shaded areas correspond to perturbations to the consumption rate constant (kc) and enzyme saturation ; more details in Methods
