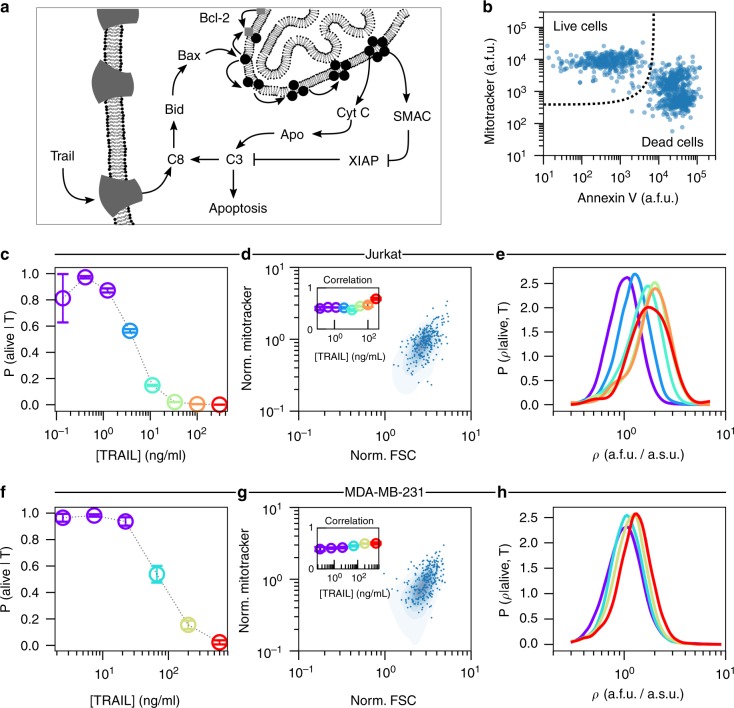
Fig. 1.
TRAIL administration enriches for cells with high density of mitochondria. a An overview of TRAIL-induced apoptosis. b Flow cytometry measurements (FCM) of mitochondria (MitoTracker Deep Red) and phosphatidylserine (FITC-conjugated Annexin V) in Jurkat cells. Complete flow cytometry gating strategy can be seen in Supplementary Fig. 1. The fractional response of Jurkat cells (c) to TRAIL. Each color corresponds to a unique fractional response to a specific TRAIL dose. Cell size measurements (FSC-A) in Jurkat cells (d) are correlated with mitochondria abundance (MitoTracker Deep Red). The inset shows that the Pearson correlation marginally changes for each TRAIL dose. The probability density of mitochondria density (ρ) for each dose of TRAIL that elicits a unique response in Jurkat cells (e). The fractional response of MDA-MB-231 cells to TRAIL (f). Cell size measurements (FSC-A) in MDA-MB-231 cell (g) are correlated with mitochondria abundance (MitoTracker Deep Red). The inset shows that the Pearson correlation marginally changes for each TRAIL dose. The probability density of mitochondria density (ρ) for each dose of TRAIL that elicits a unique response in MDA-MB-231 cells (h). In (e) and (h) the single-cell measurements from each of the lowest three doses of TRAIL are aggregated prior to probability density estimation (Violet). Visual inspection of the respective dose response curves suggests that these three doses of TRAIL are effectively identical. Data presented with error bars represent the mean ± one standard error of the mean over triplicate experiments

