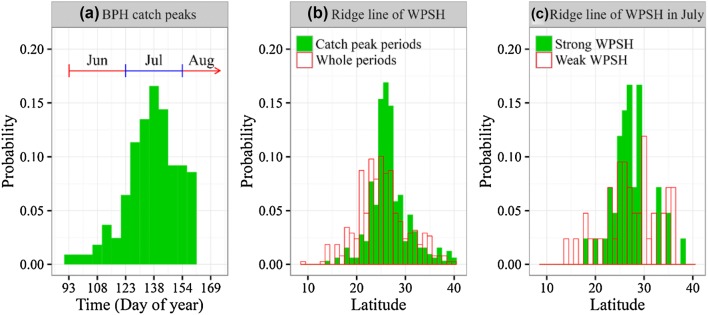
Fig. 4.
a Histogram of 5-day catch peaks of BPH recorded at the 50 stations in the Lower Yangtze Valley before mid-August during 1977–2003. b Histogram of the latitude of WPSH ridges when 5-day catch peaks were recorded at these stations (solid green bars), and during the whole period from June to early August (hollow red bars). c Histogram of the latitude of WPSH ridges in years with a strong WPSH (solid green bars) and a weak WPSH (hollow red bars). (Color figure online)

