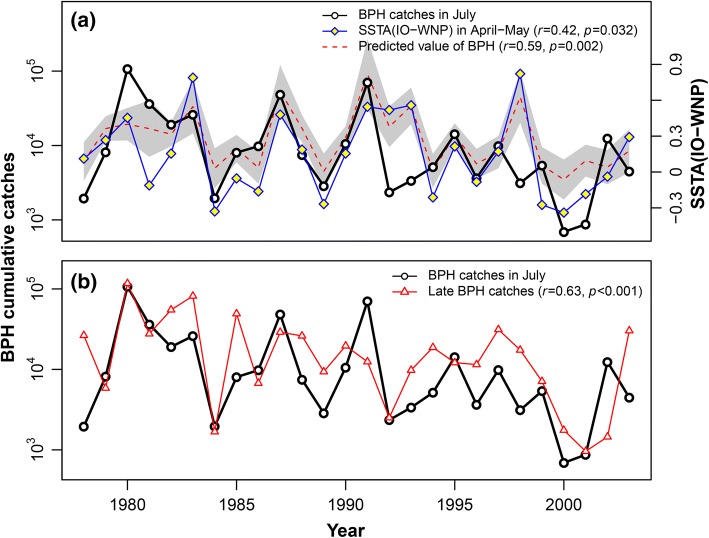
Fig. 6.
a Interannual variations in the immigration levels of BPH in July (solid black line) in comparison with the SSTA(IO–WNP) index for April–May (solid blue line). Also shown is the predicted immigration level in July (red dotted line) based on values of the SSTA(IO–WNP) index for April–May and catches in South China in May (see the solid green line in Fig. 5). The Pearson’s correlation coefficient (r) of July BPH catches and model predictions was 0.59 (df = 24, p = 0.002). b Interannual variations in the BPH immigration levels in the Lower Yangtze Valley in July (solid black line) were significantly correlated to catches late in the season (solid red line) (r = 0.63, df = 24, p < 0.001). (Color figure online)

