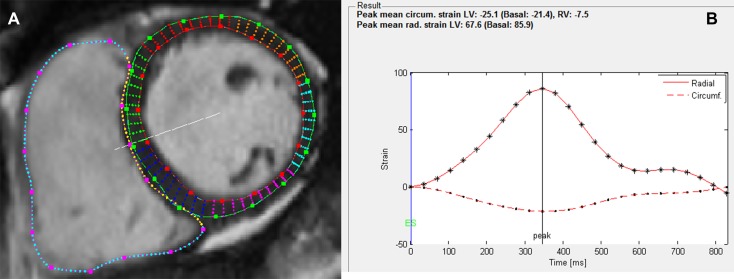
Fig. 1.
a Basal short-axis view of the left and right ventricles at end diastole. LV epicardial and endocardial borders as well as RV endocardial borders have been manually drawn in the image. Points along the borders allow manual correction of the segmentation. b The resulting strain curves for mean LV circumferential (dashed line) and radial strain (solid line). Different markers along the curves (. and *) correspond to different time points in the cine image sequence, i.e., there are 25 temporal phases

