Fig. 1.
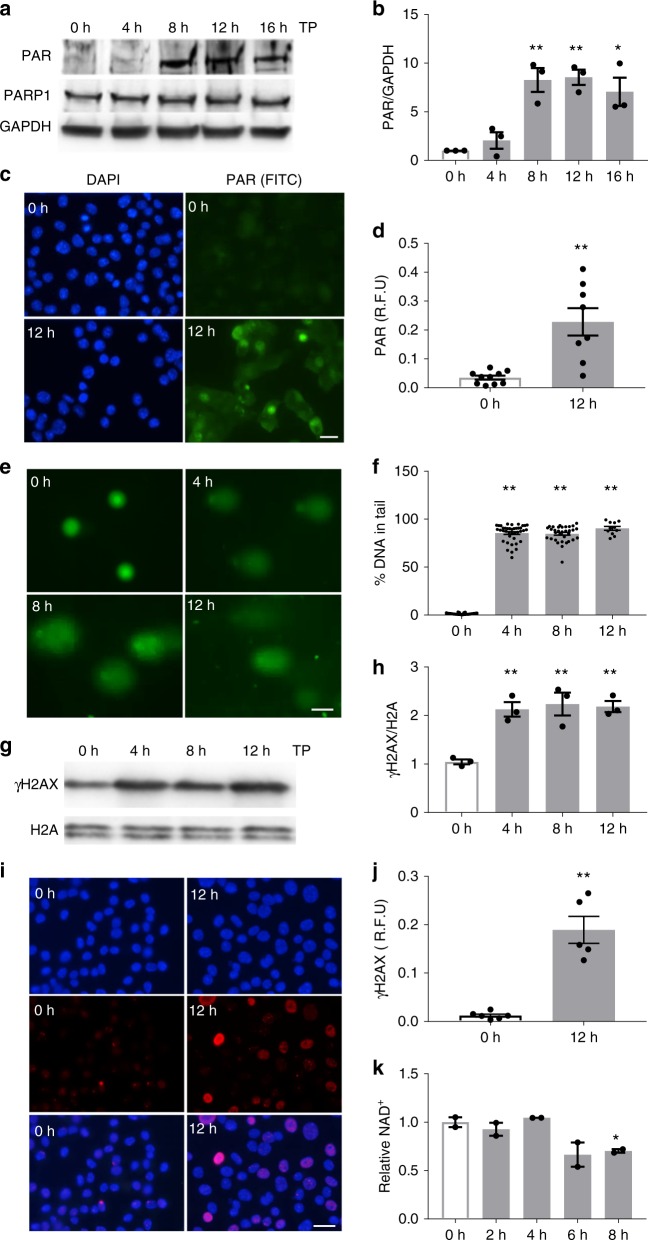
Tachypacing induces PARP activation, DNA damage, and NAD+ depletion in HL-1 cardiomyocytes. a Representative Western blot of PAR and PARP1 levels in control nonpaced (0 h) and tachypaced (TP) HL-1 cardiomyocytes for durations as indicated. b Quantified data of PAR expression levels from three independent experiments. *P < 0.05 vs. 0 h, **P < 0.01 vs. 0 h. c, d Immunofluorescent staining and quantified data of PAR levels in control (0 h), and in 12 h TP of HL-1 cardiomyocytes. **P < 0.01 vs. 0 h, n = 10 images for 0 h, n = 8 images for 12 h from over 200 cardiomyocytes. e Representative immunofluorescence images of HL-1 cardiomyocytes with time-course TP (0–12 h), showing tail DNA. f Quantified percentage of tail DNA in HL-1 cardiomyocytes **P < 0.01 vs. 0 h, n = 49 cardiomyocytes for 0 h, n = 40 for 4 h, n = 33 for 8 h, n = 11 for 12 h. g, h Representative Western blot of γH2AX, H2A, and quantified data of γH2AX during time-course of TP in HL-1 cardiomyocytes. **P < 0.01 vs. 0 h, n = 3 independent experiments. i, j Representative immunofluorescent staining and quantified data of γH2AX levels in NP (0 h) and TP (12 h) HL-1 cardiomyocytes. **P < 0.01 vs. 0 h, n = 7 images for 0 h, n = 6 images for 12 h from over 200 cardiomyocytes. k Relative NAD+ levels in HL-1 cardiomyocytes during time-course of TP (2–8 h) compared to control (0 h). *P < 0.05 vs. 0 h. n = 2 independent experiments. Scalebar is 15 µm for c, e and i. Data are all expressed as mean ± s.e.m. Individual group mean differences were evaluated with the two-tailed Student’s t test

