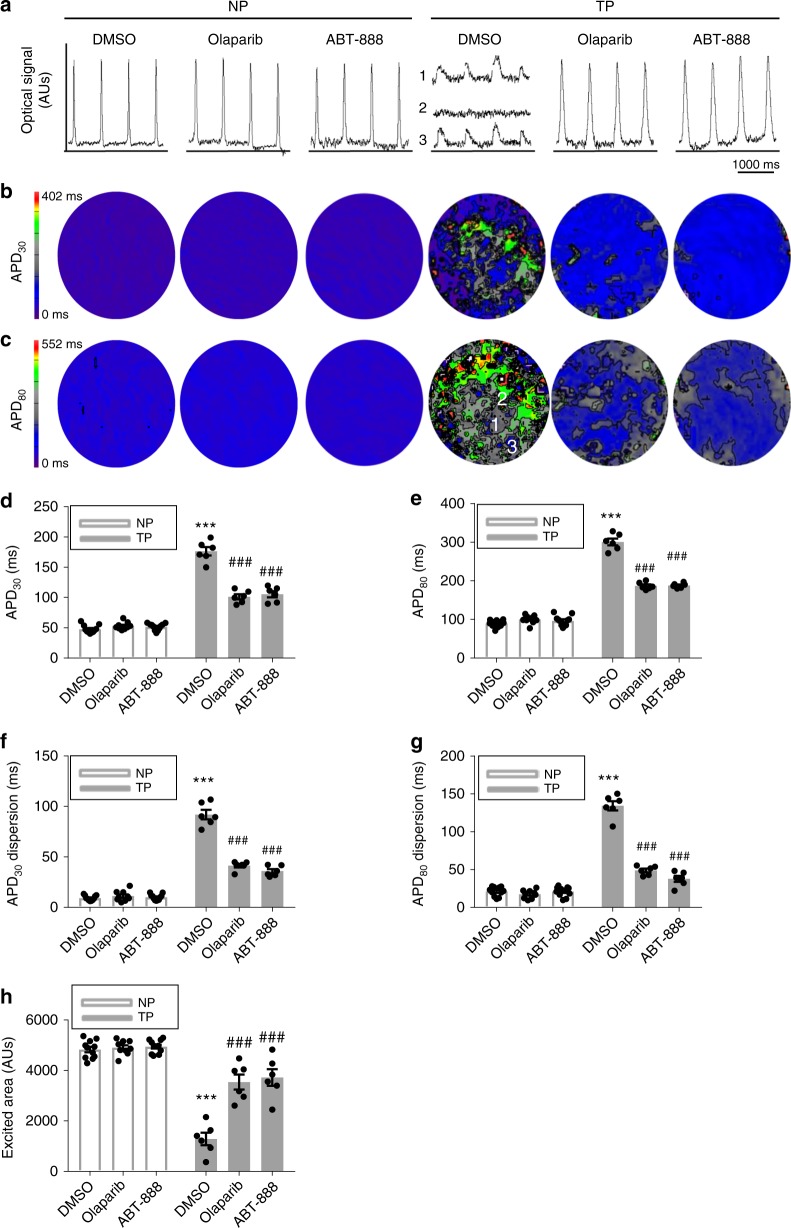
Fig. 5.
PARP1 inhibitors significantly attenuated tachypacing-induced electrophysiological deterioration in HL-1 cardiomyocytes. a–h Optical voltage mapping of HL-1 cardiomyocyte monolayers following 1-Hz electrical stimulation in control nonpaced (NP) or 8 h tachypaced (TP) HL-1 cardiomyocytes with 20 µM olaparib, 40 µM ABT-888 or vehicle DMSO 12-h pretreatment before tachypacing. a Representative filtered optical signal traces. To indicate electrical heterogeneity, three tracers which vary in time and space [1 and 3] to excitation block [2] in the TP DMSO group are depicted b typical APD30 and c APD80 maps for indicated groups. d–h Corresponding quantitative analysis of APD30, APD80, APD30 dispersion, APD80 dispersion and excited cell surface area, showing that TP resulted in significant APD prolongation (a, d, e), an increase in APD dispersion (b, c, f, g) and a significant decrease of excited cell surface area (h) in HL-1 cardiomyocyte monolayers. Pretreatment of HL-1 cultures with ABT-888 or olaparib significantly prevented the tachypacing-induced electrophysiological deteriorations (a–h). ***P < 0.001 vs. DMSO NP, ###P < 0.001 vs. DMSO TP. n = 11 for NP DMSO, n = 9 for NP olaparib TP, n = 11 for NP ABT-888, n = 6 for TP DMSO, n = 6 for TP olaparib, n = 6 for TP + ABT-888. n = number of experiments. Data are all expressed as mean ± s.e.m. Individual group mean differences were evaluated with the two-tailed Student’s t test

