Figure 1.
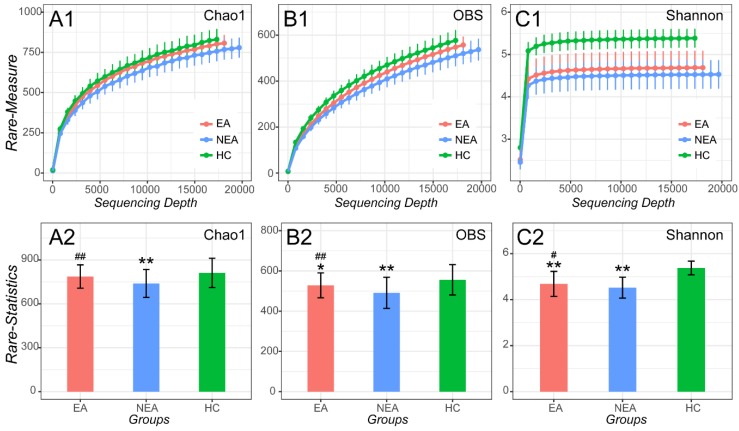
Alpha-diversity analysis of microbiome in eosinophilic asthma (EA) group, non-eosinophilic asthma (NEA) group and healthy control (HC) group. Rarefaction measure of Chao1 index (A1), Observed species index (OBS, B1) and Shannon index (C1) from sequencing matrix in different sequencing depth. Chao1 index statistics (EA vs NEA P<0.01, NEA vs HC P<0.01) (A2), Observed species index statistics (EA vs NEA P<0.01, EA vs HC P<0.05, NEA vs HC P<0.01) (B2) and Shannon index statistics (EA vs NEA P<0.05, EA vs HC P<0.01, NEA vs HC P<0.01) (C2) from matrix sequencing at the depth of 15,750. **, P<0.01 vs HC. #, P<0.05 vs NEA. ##, P<0.01 vs NEA.

