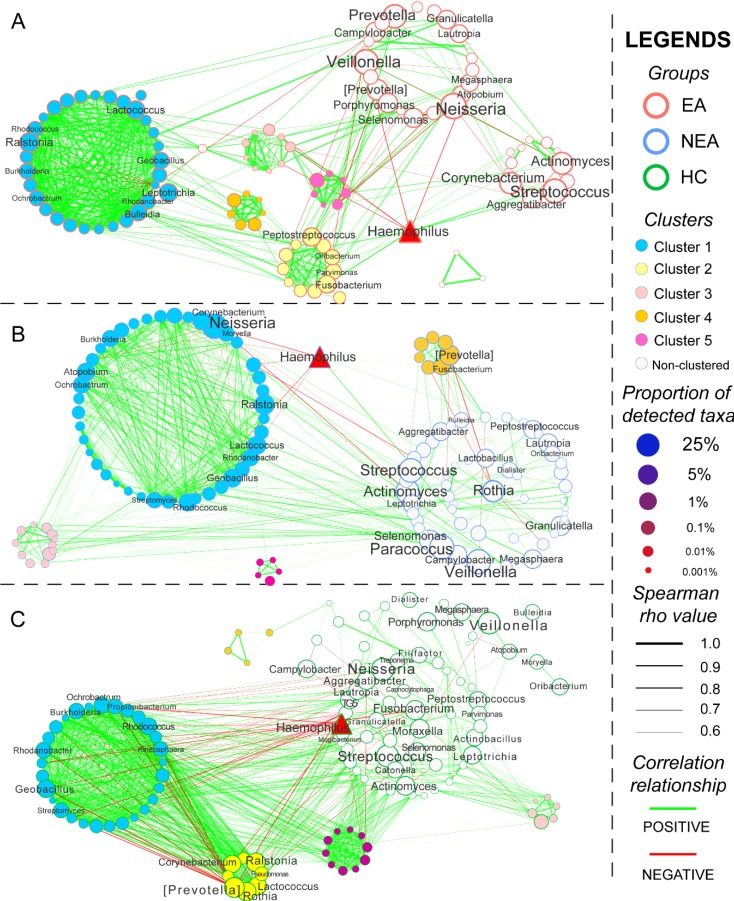
Figure 4.
Network analysis and the metabolic prediction of microbiome. The networking pattern of all genera in eosinophilic asthma (EA) group (A), non-eosinophilic asthma (NEA) group (B) and healthy control (HC) group (C) under the criteria of rho > 0.6 and P < 0.05. (Green line represents the positive correlation and red line represents the negative correlation. The size of the point in the network represents the relative abundance of different genera in every groups. All clusters are coloured and displayed with circular layout in the three groups. The red triangle represents a critical genus reported extensively.)

