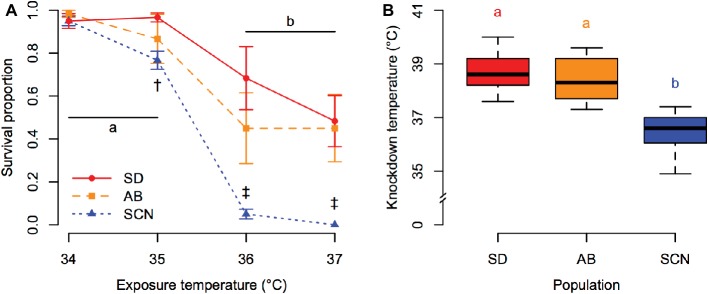
Figure 2.
Acute upper thermal tolerance assessed by survivorship of 1-h heat stress (A) and knockdown temperature (B) in San Diego (SD; red, circles, solid lines), Abalone Cove (AB; orange, squares, dashed lines), and Santa Cruz (SCN; blue, triangles, dotted lines) copepods. (A) Data are presented as mean ± SEM; shared letters indicate temperatures that are not significantly different within populations; dagger symbols indicate differences among populations within a temperature († = SCN different from SD, ‡ = SCN different from SD and AB). (B) Data are presented as box plots; shared letters indicate populations that do not differ significantly.

