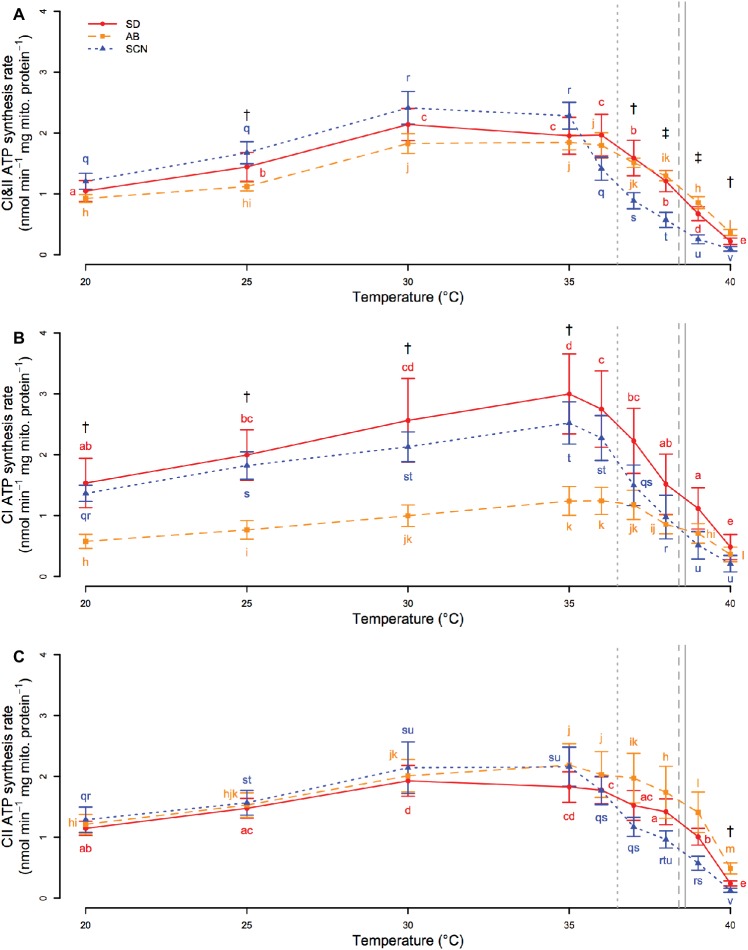
Figure 4.
CI&II- (A), CI- (B), and CII-fueled (C) ATP synthesis rate from 20 to 40°C in San Diego (SD; red, circles, solid lines), Abalone Cove (AB; orange, squares, dashed lines), and Santa Cruz (SCN; blue, triangles, dotted lines) copepods. Data are presented as mean ± SEM. Letters indicate the results of post-hoc tests within populations. Daggers indicate temperatures at which there is a difference between SCN and AB. Double daggers indicate temperatures at which there is a difference between SCN and both AB and SD. Vertical gray lines display mean knockdown temperatures for each population (SD – solid; AB – dashed; SCN – dotted).

