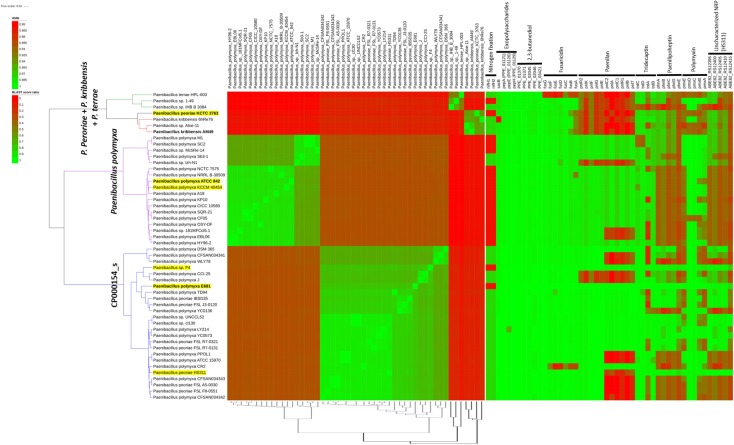
FIGURE 2.
Comparative genomic analysis of 50 selected Paenibacillus strains. All available genome sequences, identified by TrueBac ID (https://help.ezbiocloud.net/user-guide/truebac-id/about-truebac-id/) and belonging to the species P. polymyxa (18 strains), “CP000154_s” (25), P. peoriae (1), P. kribbensis (3), and P. terrae (3), were downloaded from EzBioCloud and BLASTN-based pairwise ANI values were calculated using pyani (https://github.com/widdowquinn/pyani). Species were chosen whose 16S rRNA gene sequences were similar to those of E681 (>96% similarity). Type strains and E681 are shown in boldface; strains in a yellow background represent those sequenced by our group; and strains grouped in the same species in EzBioCloud have the same clade colors. The left heatmap shows the ANI matrix, where rows are sorted according to the complete linkage clustering data calculated in the R environment (hclust function) and columns are sorted as they appear in dRep (Olm et al., 2017) primary clustering (dendrogram shown at the bottom of the heatmap). The BLAST score ratio matrix shown in the right heatmap shows the presence of selected genes across strains using the LS-BSR method (Sahl et al., 2014). nifH sequences and genes starting with ABE82 were collected from P. durus ATCC 35681 (AJ515294.1 and AJ299453.1) and P. peoriae HS311 (CP011512.1), respectively. All other sequences were retrieved from strain E681. The figure was drawn using the iTOL server (Letunic and Bork, 2016).

