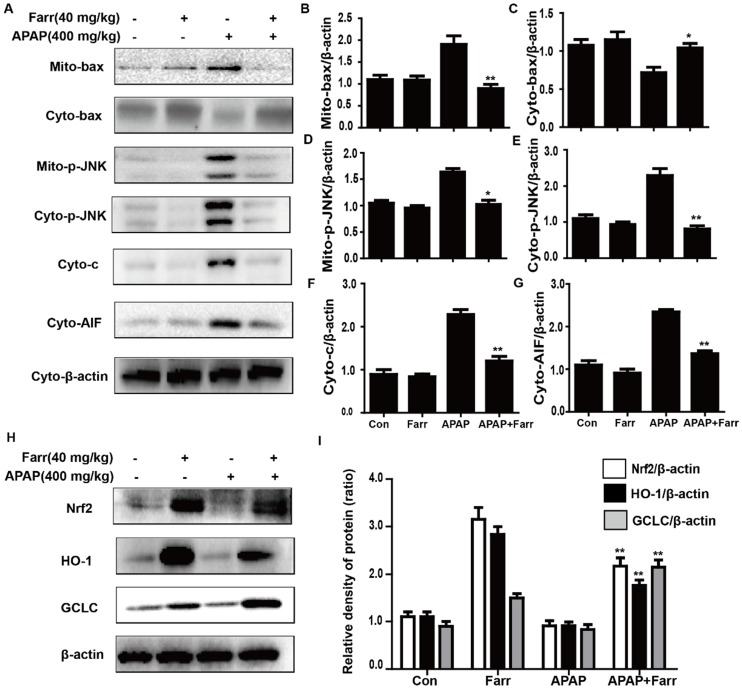
Fig 3.
Effect of farrerol treatment on APAP-induced mitochondrial dysfunction and antioxidant signaling pathways. (A-G) Immunoblot analysis was performed to determine the levels of Bax, AIF, cytochrome c and JNK in mitochondria isolated from liver tissues harvested at 3 h post-APAP injection. (H-I) Liver tissue lysates were examined for Nrf2, HO-1 and GCLC by western blot analysis. All of the data represent the average from three independent experiments. *p < 0.05 and **p < 0.01 versus the APAP group.

