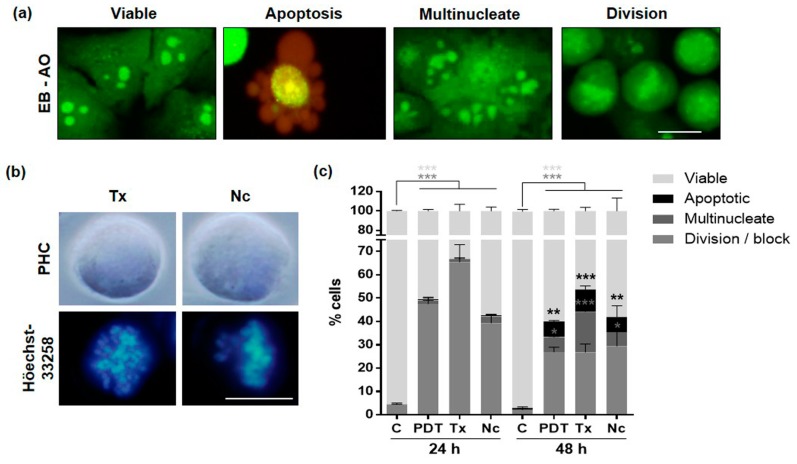
Figure 4.
Morphology classification after fluorochome staining. (a) In vivo analysis 24 h after MAL-PDT by fluorescence microscopy after ethidium bromide (EB)-acridine orange (AO) staining. This staining allows differentiating between: (1) viable (fluorescing in green due to AO) (2) apoptotic (fluorescing in red/yellowish due to AO/EB), (3) multinucleate, and (4) dividing cells. (b) Cellular and nuclear morphology 24 h after treatment with 0.05 µM Tx or 0.25 µM Nc observed by PHC or Höechst-33258. (c) Percentage of viable, dividing, apoptotic and multinucleated cells 24 and 48 h after treatments application (values relative to control cells) (* p < 0.05; ** p < 0.01; *** p < 0.001). C: Control; Tx: taxol; Nc: nocodazole. Scale bar: 10 μm.

