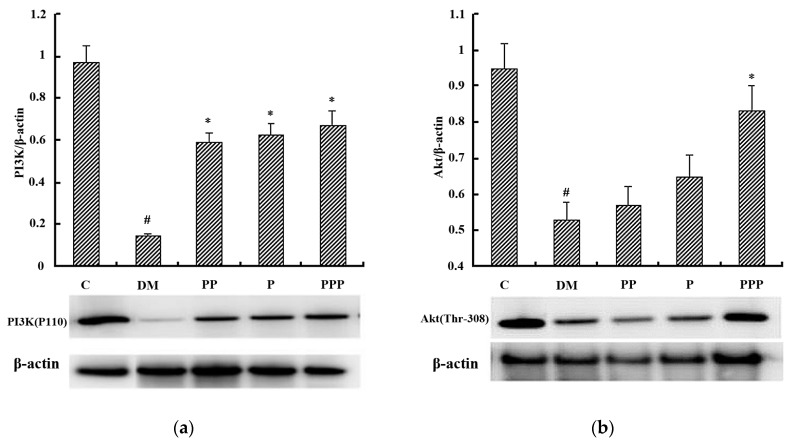
Figure 8.
A Western blot analysis of the proteins that are associated with the PI3K/Akt pathway (n = 10). (a) A relative density analysis of PI3K. (b) A relative density analysis of Akt. The relative density of PI3K and Akt is expressed as a ratio (PI3K/β-actin, Akt/β-actin). # p < 0.05 compared with the C group; * p < 0.05 compared with the DM group.

