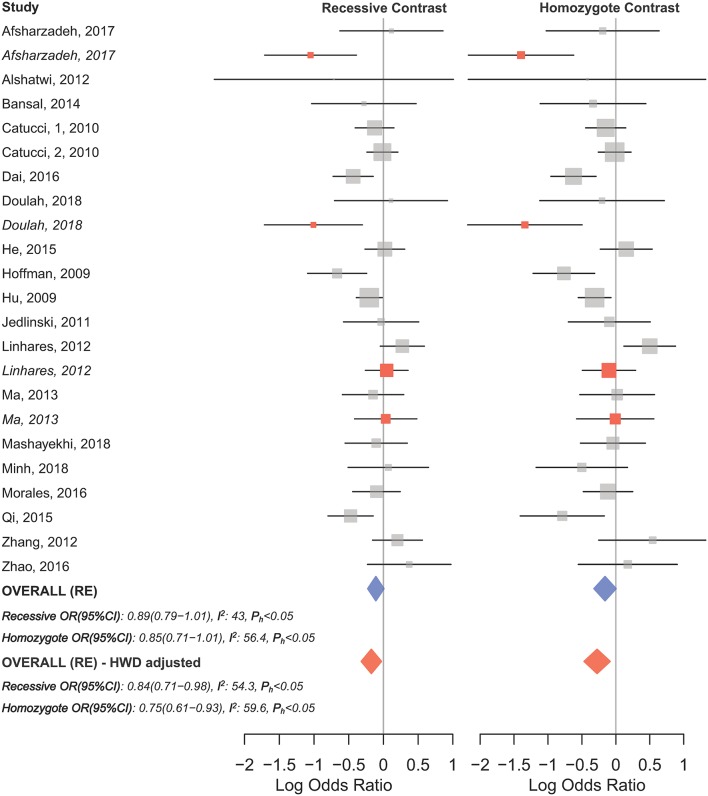
Figure 6.
Forest plot of the original and HWD-adjusted meta-analysis of breast cancer risk and mir-196a-2 rs11614913 under the recessive (TT vs. CT+CC) and homozygote (TT vs. CC) models. Red boxes represent HWD-adjusted log ORs and 95%CIs of studies with HWE-deviated controls (i.e., Linhares et al., 2012; Ma et al., 2013; Afsharzadeh et al., 2017; Doulah et al., 2018). The blue and red diamonds represent the estimated pooled effects of the original and HWD-adjusted meta-analysis, respectively.

