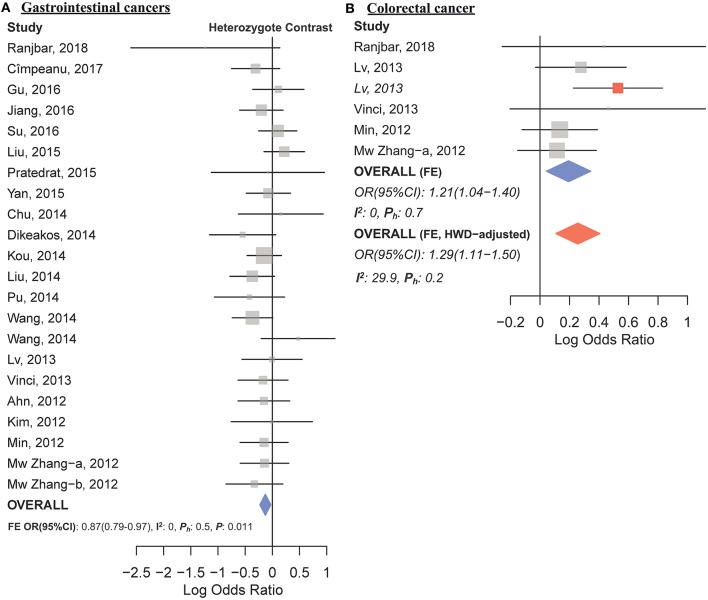
Figure 7.
Forest plots of cancer risk associated with mir-149 rs2292832; (A) In the gastrointestinal cancers subgroup assuming the heterozygote model (CT vs. CC). (B) In the colorectal cancer subgroup assuming the recessive model (TT vs. CT+CC). The red box shows the HWD-adjusted log OR (95%CI) for the study by Lv et al. (2013). The blue and red diamonds represent the estimated pooled effect of the original and HWD-adjusted meta-analysis.

