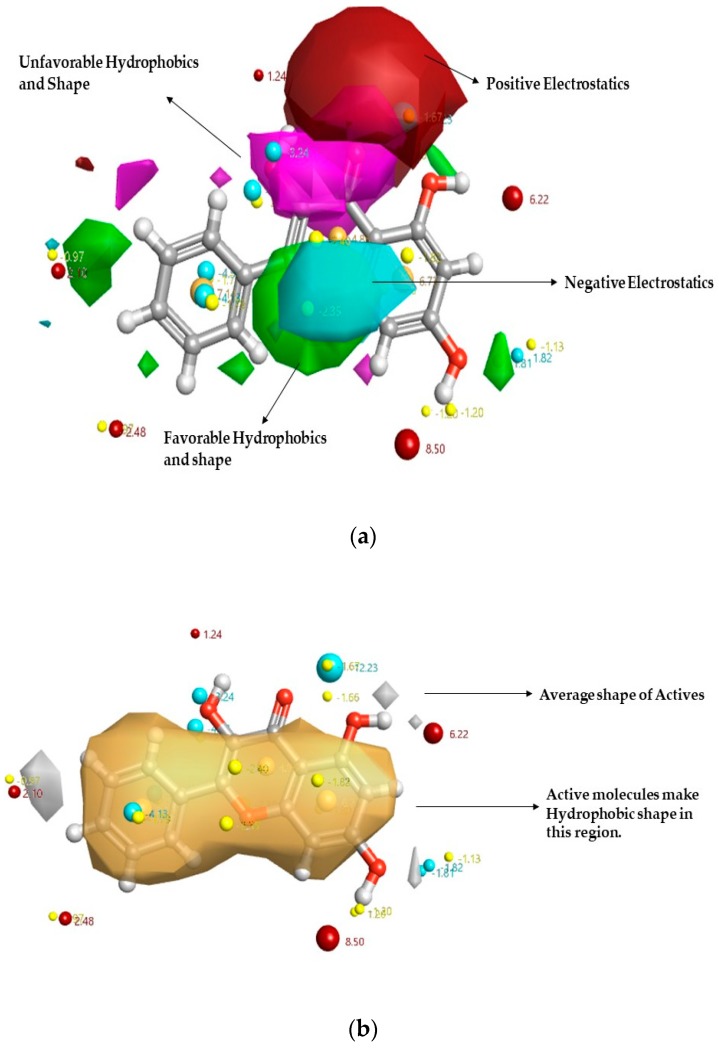
Figure 2.
Qualitative structure–activity relationship (SAR) model of the DPP-4 inhibitor model map is superposed to galangin. The molecular insight of SAR mechanism models, revealing DPP-4 inhibitors of natural compounds, as detected through an average of actives and activity cliff summary study: (a) Positive field region is shown in red controls the DPP-4 inhibitory activity; green color shows favorable hydrophobic feature and pink color shows unfavorable hydrophobic shape; While the negative region in cyan: (b) The white region shows the inhibitory activity shape feature, and yellow color shows the hydrophobic shape of inhibitory activity.

