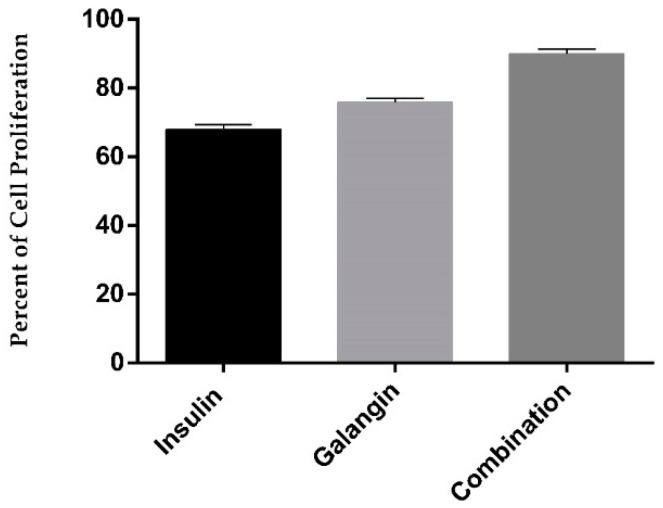
Figure 5.
Effect on the percent of cell proliferation on differentiated rat L6 skeletal muscle cells over 24 h with different treatments of 10 nM insulin alone, 270.2 µg/mL galangin alone, and in combination (10 nM insulin and 270.2 µg/mL galangin). All data are represented in the graph as the mean ± standard deviation of six different experiments.

