Figure 3.
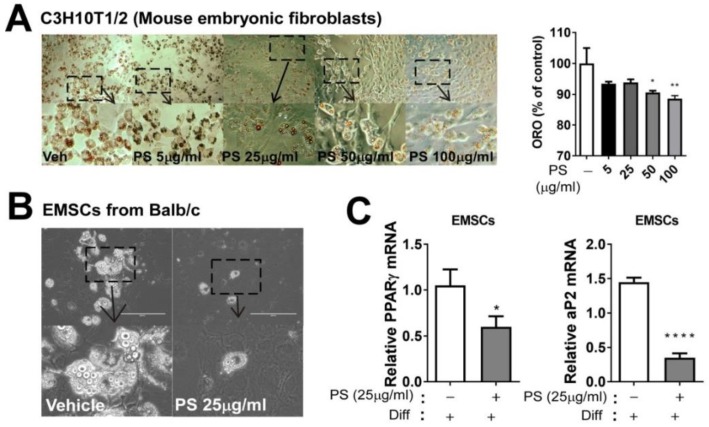
PSE inhibits adipogenesis in C3H10T1/2 mouse embryonic fibroblasts, adipocytes, and EMSCs. C3H10T1/2 cells were seeded and induced to differentiation in the presence of either DMSO (vehicle control) and PSE (5–100 μg/mL) for four days: (A) Triglyceride accumulation was visualized by Oil red-O staining and representative images from three separate experiments are shown in (left) (magnified 4×); extracted ORO staining was quantified (OD 500 nm) (right). Primary adipocytes were prepared from EMSC of Balb/c mice: (B) Phase contrast images of primary adipocytes were differentiated with or without PSE (25 μg/mL) for seven days (magnified 4×, scale bar = 400 μm); (C) adipogenic gene expression of PPARγ and aP2 by qPCR. * p < 0.05; ** p < 0.01; **** p < 0.0001 compared with the vehicle control (DMSO treated cells) by one-way ANOVA with Bonferroni’s comparison test or Student’s t-test. +; treatment, -; non-treatment.

