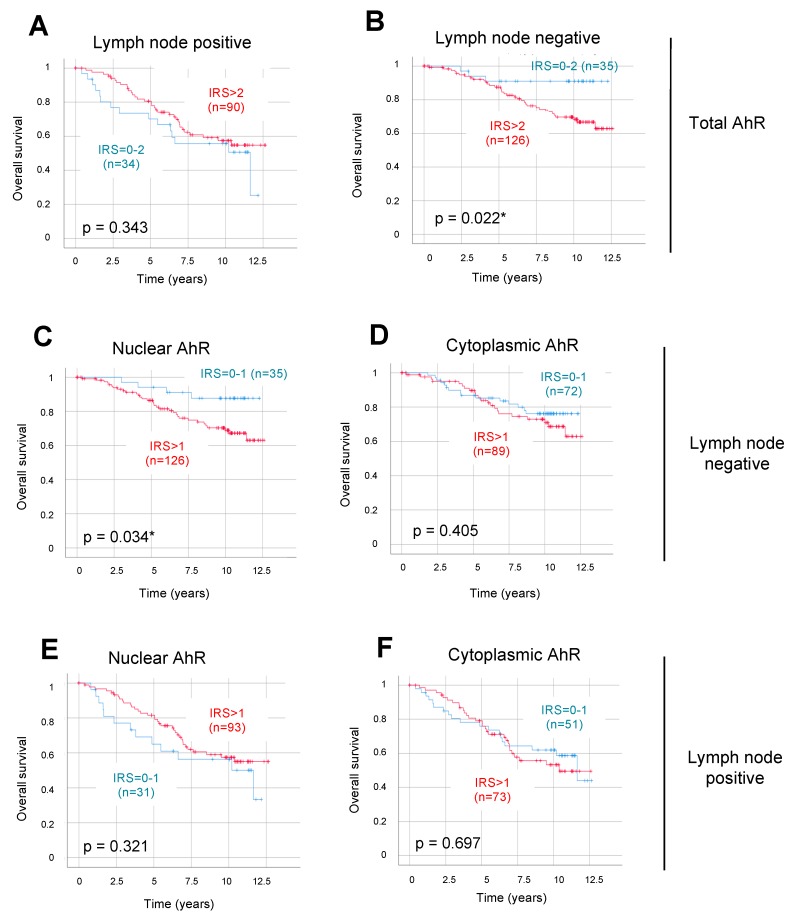
Figure 3.
Overall patient survival according to total, nuclear, and cytoplasmic AhR expression in lymph node-negative versus lymph node-positive BC. Kaplan–Meier analysis of the correlation between OS and total AhR expression in lymph node-positive (A) or lymph node-negative (B) patients, and nuclear or cytoplasmic AhR in lymph node-negative (C and D, respectively) or lymph node-positive patients (E and F, respectively). The IRS cut-off values together with the number of cases in each arm are indicated in each panel, for low (in blue) or high (in red) AhR expression. Correlations were statistically significant for p < 0.05 (*).

