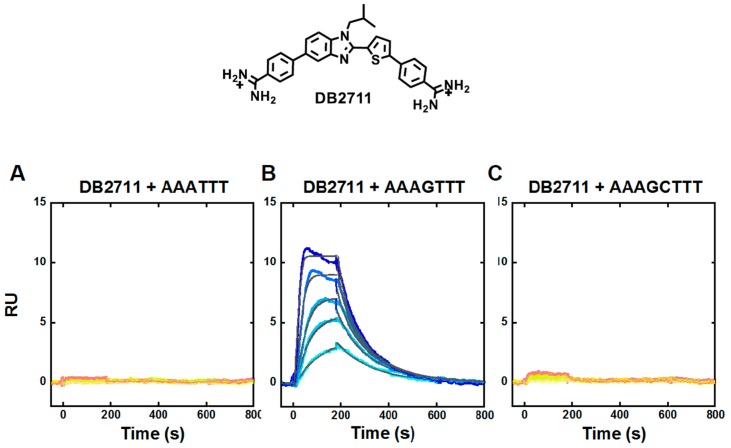
Figure 5.
Representative SPR sensorgrams for DB2711 in the presence of (A) AAATTT, (B) AAAGTTT and (C) AAAGCTTT hairpin DNAs. In A, C, the concentrations in the sensorgrams are 2–100 nM of each compound from bottom to top. In B, the concentrations of DB2711 from bottom to top are 15, 30, 40, 70, and 100 nM; In B, the solid black lines are best-fit values for global kinetic fitting of the results with a single site function.

