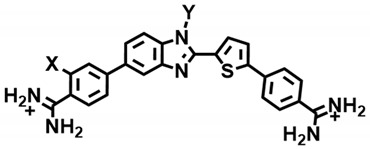
Table 1.
Summary of binding affinity (KD, nM) for the interaction of representative compounds with biotin-labeled DNA sequences using biosensor-SPR method a.

| |||||
|---|---|---|---|---|---|
| Compounds | X | Y | KD (nM)/Selectivity Ratio AAATTT | KD (nM) AAAGTTT | KD (nM)/Selectivity Ratio AAAGCTTT |
| DB2457 | H | Me | 222/56 | 4 | 192/48 |
| DB2708 | H | i-Pr | 1020/255 | 4 | 223/56 |
| DB2711 | H |

|
NB/-- | 13 | NB/-- |
| DB2714 | H |

|
NB/-- | 9 | 1330/148 |
| DB2727 | H |

|
NB/-- | 14 | 388/28 |
| DB2740 | H |

|
NB/-- | 3 | 107/36 |
| DB2759 | Cl | i-Pr | NB/-- | 14 | NB/-- |
| DB2762 | CF3 | i-Pr | NB/-- | 94 | NB/-- |
a All the results in this table were obtained in Tris-HCl buffer (50 mM Tris-HCl, 100 mM NaCl, 1 mM EDTA, 0.05% P20, pH 7.4) at a 100 μL/min flor rate. NB means no binding. The listed binding affinities are an average of two independent experiments carried out with two different sensor chips and the values are reproducibile within 10% experimental errors.
