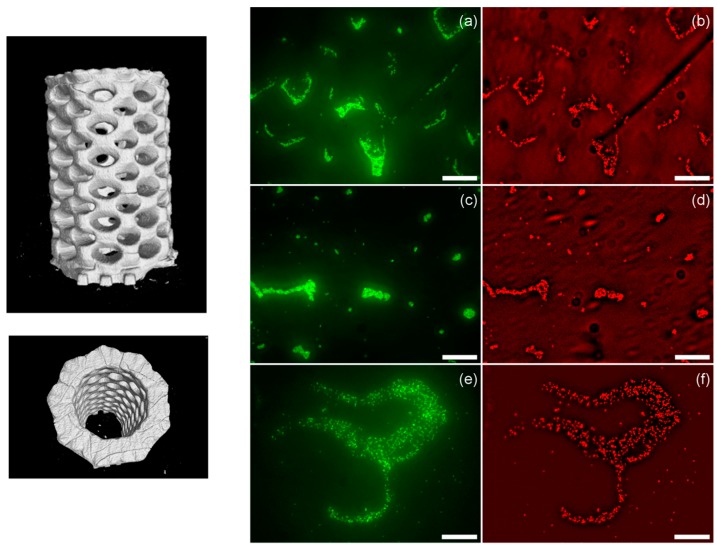
Figure 10.
Left: Lateral and top 3D views of the micro-computed topography (µ-CT) images of the fabricated parts. Right: Bacterial viability on the different hydrogels with a variable amount of acrylic acid (AA). (a,b) 25 wt% AA, (c,d) 20 wt% AA, and (e,f) 10 wt% AA. Green fluorescence corresponds to the emission of all the bacteria, while the red one is related to the emission of propidium iodide (dead bacteria). Reproduced with permission from Ref. [95].

