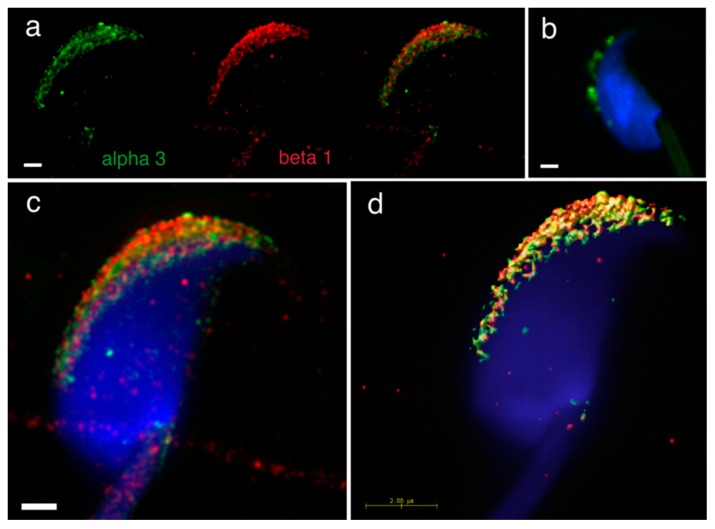
Figure 4.
Mutual localization of α3 and β1 integrin subunit and a presence of α3β1 heterodimer revealed by SIM and PLA. (a) α3 (green) and β1 (red) are localized in the acrosomal cap area of intact sperm head, (b) PLA confirmed a presence of the α3β1 heterodimer. (c) SIM depicted their mutual localization in same structures. (d) Huygens software was used for better visualization of colocalization area (yellow) of α3 and β1. Colocalization maps are based on Pearson’s correlation coefficient. Nucleus is visualized with Dapi (blue). Scale bar represents 1 μm (a–c) and 2 μm (d).

