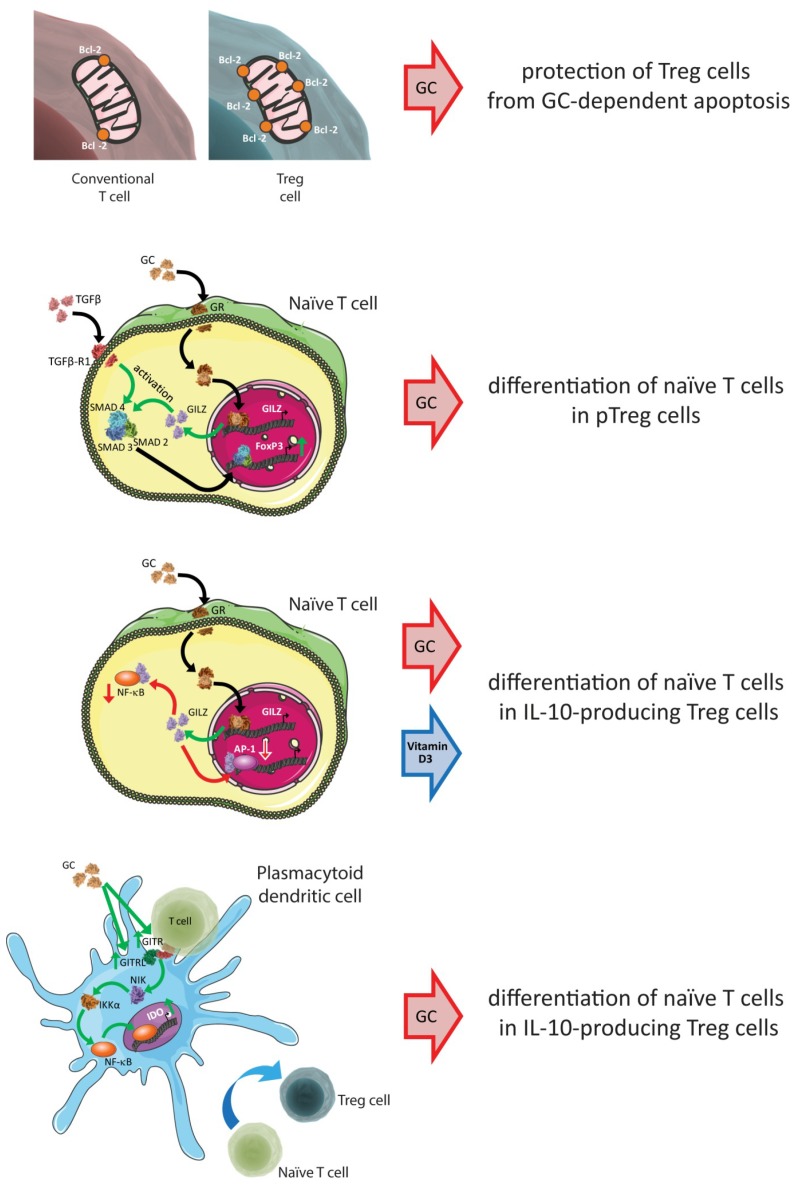
Figure 2.
Key signaling molecules determining Treg cell survival/expansion/differentiation. The figure summarizes the key mechanisms by which GC treatment increases the number of Treg cells, which are described in detail in Section 8 of this review. Mechanisms include the increased expression by Treg cells of anti-apoptotic signals (upper panel), and the modulation of pathways in naïve T cells (middle panels) and non-T cells (lower panel). Red arrows indicate decreased expression and inhibition; green arrows indicate increased expression and activation.

