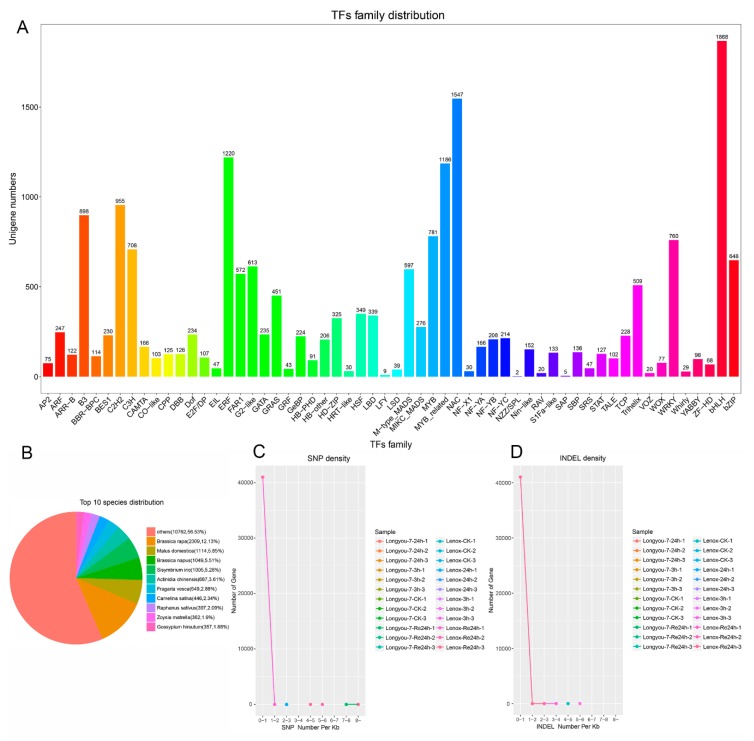
Figure 5.
Summary of statistical analysis of transcription factors (TFs), SSRs, and SNPs with cold treatment. (A) 58 differentially expressed TFs; (B) identified TFs clustered into top 10 species distributions; (C) SNP density distribution map; the horizontal axis is the number of SNPs per 1000 bp sequence on the gene and the vertical axis is the number of genes; (D) INDEL density map; the horizontal axis is the number of INDELs per 1000 bp sequence on the gene and the vertical axis is the number of genes.

