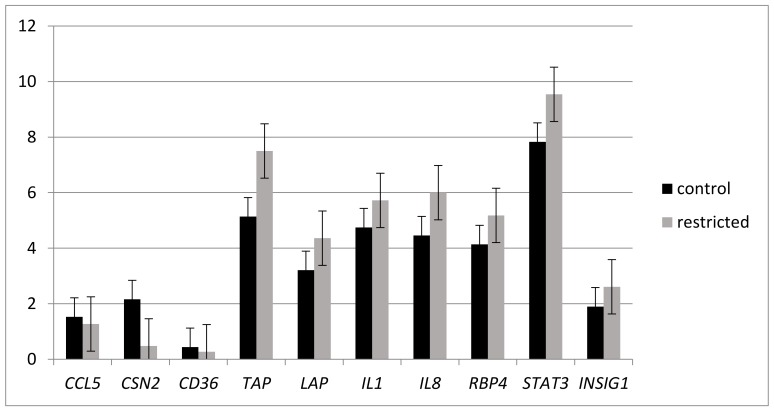
Figure 1.
Effects of nutrient restriction and intra-mammary lipopolysaccharide (LPS) challenge on gene mRNA expression quantified by RT-qPCR and presented as ∆CT. Comparison of the gene expression does not show a difference between control (CONT; n = 6) and restricted (REST; n = 6) Holstein cows (p ≥ 0.1). The expression of the TAP gene tended to differ (p = 0.07). UXT2, CLN3, and EIF3K were used as housekeeping genes.

