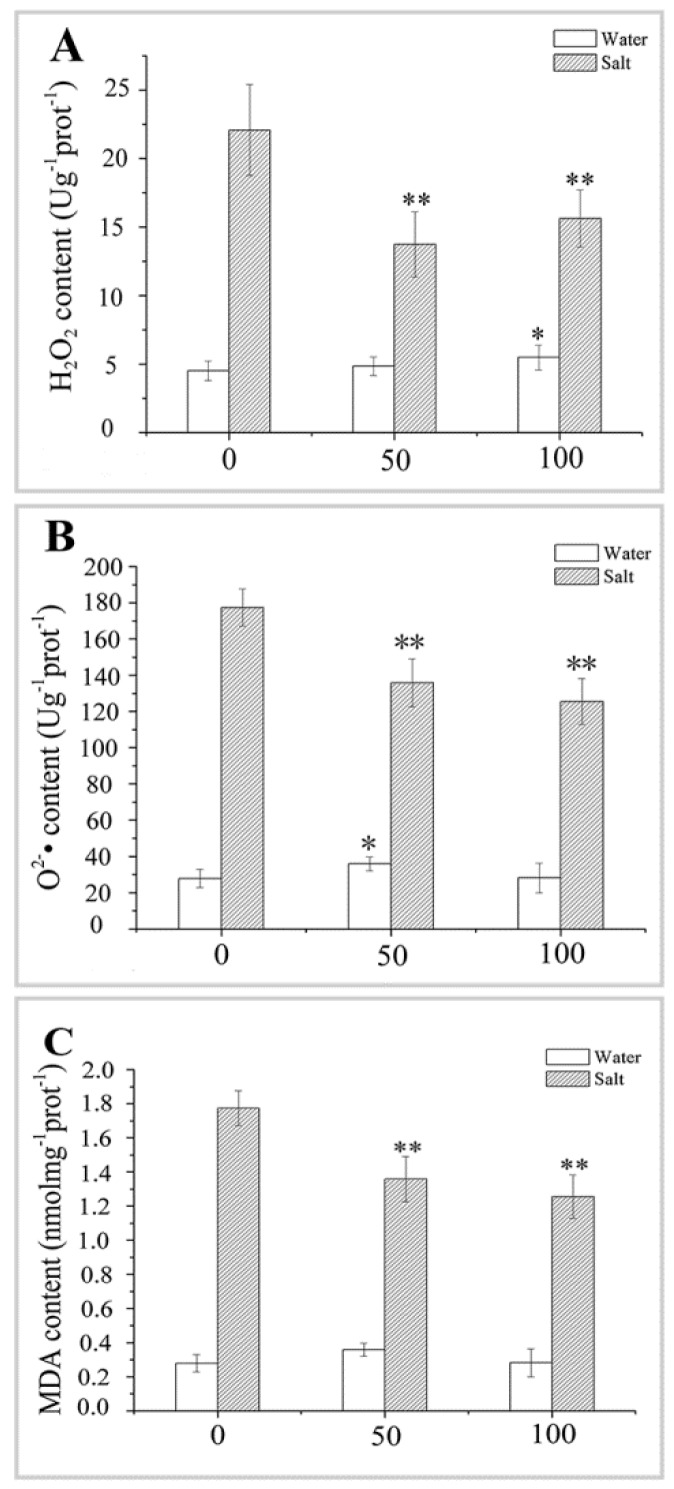
Figure 6.
Effect of pretreating with different concentrations of melatonin (MT) on the changes of ROS in leaves of naked oat seedlings under salt stress. (A) Hydrogen peroxide (H2O2) content; (B) superoxide anion (O2•–) content; and (C) malondialdehyde (MDA) content. Values are mean ± standard deviation (n = 3). 0, 50, and 100 represent MT concentration (μM) in Figure 6. Asterisks; * and ** indicate significant difference (p < 0.05 and p < 0.01) compared with mock coating (0 μM). Measurement was carried out after six days of the salt plus MT pretreatmemt.

