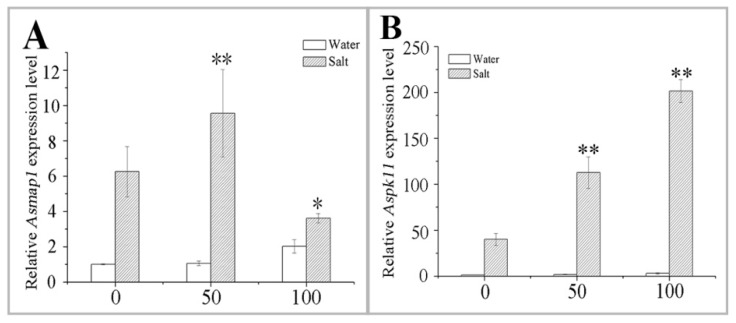
Figure 8.
Effect of pretreating with different concentrations of melatonin (MT) on the expression of MAPK in leaves of naked oat seedlings under salt stress. The relative expression of MAPK genes Asmap1 (A) and Aspk11 (B). Values are mean ± standard deviation (n = 3). 0, 50, and 100 represent MT concentration (μM) in Figure 8. Asterisks; * and ** indicate significant difference (p < 0.05 and p < 0.01) compared with mock coating (0 μM). Measurement was carried out after six days of the salt plus MT pretreatmemt.

